1. Introduction
he need for information is constant. For example, in the prehistoric period, knowledge about poisonous plants, dangerous animals, etc., was the key to survival for an individual. Information on obtaining food, water, making your home, etc. is vital. Without the invention of communication and the exchange of information, humanity would be doomed to extinction. Now, humankind has ample opportunities to create, store and transmit information. The concept, types, properties of data, and the number of information resources in any field of human activity are growing enormously. The amount of information transmitted is constantly increasing: from household conversations to the data flow on the Internet. The reason is the complexity of all areas of modern society. The determining factor is the development of technology and scientific progress.
2. II.
3. Walsh Function
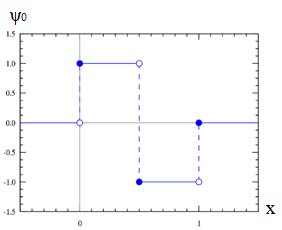
A Walsh [1] function is a family of functions that form an orthogonal system and take only +1 and 1 values throughout the definition. These functions are derived from Rademacher`s functions.
Easy processing is one of the main advantages of transforming the Walsh basis, but special generators are needed to form such functions. There are now several Walsh function generator circuits. See Fig. 1 for one possible variant of the first eight functions generator design.
4. C
The algorithm for forming Walsh [2] functions in this generator is based on the multiplication of Rademacher functions r1(?), r2(?), and r3(?). The function r3(?) of the meander type is generated directly by the assigning generator and has the maximum frequency for the set of used functions. The functions r2(?) and r1(?) are obtained by triggering the countdown input by dividing the input frequency by 2. To get the remaining Walsh functions, adders by modulo 2 with inverse outputs are used as multipliers. On the output of triggers and augmentation circuits modulo 2, the voltage has two levels, 0 and 1, while Walsh functions, by definition, have levels -1 and +1. The level conversion is carried out by operational amplifiers, which compare the input signal with the offset voltage E = 1/2.
The Walsh transform converts the signal to a set of rectangular or square signals (fig. 2).
Fig. 2: Walsh basis for 8x8 images
The Walsh transform for two-dimensional signals is as follows:
(2)
The inverse Walsh transform is determined by the formula:
(
III.
5. Wavelet Haar Transform
The wavelet transformation [3] decomposes the signal into a set of essential functions called wavelets. Wavelet transformation is a time-frequency transformation, that calculates moving averages and differences through scalar products with scaling signals and wavelets. Wavelets are not defined in terms of scaling and wavelet functions. Wavelet has balanced frequency characteristics. Wavelets use overlapping windows, so the spectrum of the high-frequency coefficient reflects all high-frequency changes (fig. 3).
?? ???? = 1 ?? ? ? ??(??, ??)(-1) ? ??? ?? (??)?? ?? (??)+?? ?? (??)?? ?? (??)? ?? ??=0 ??-1 ??=0 ??-1 ??=0 ??(??, ??) = 1 ?? ? ? ?? ???? (-1) ? ??? ?? (??)?? ?? (??)+?? ?? (??)?? ?? (??)? ?? ??=0 ??-1 ??=0 ??-1 ??=0IV.
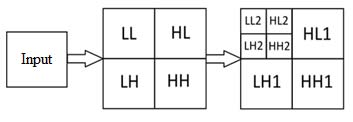
6. Image Compression
Image compression [4] is a science that reduces the number of bits required to store, transmit and recover images without losing information. Lossless compression techniques are used to compress and unpack images. The compressed image can be sent via a cloud network on the recipient side, and the image can be reconstructed. The flowchart of the proposed algorithm is shown in fig. 5 The efficiency of the proposed algorithm is confirmed in terms of performance indicators, such as the ratio of peak to signal and noise (PSNR), standard error (MSE), and compression ratio (CR). Input images from datasets are shown in Fig. 7.After compression, the file will be with the.wwt. On the receiver side, inverse transformations are applied to obtain the reconstructed image (fig. 8). The PSNR peak signal/noise ratio measures the quality between the original and compressed images. High PSNR value gives better quality compressed and reconstructed images. PSNR is usually expressed as a formula:
7. Fig. 7: Input image
(
The compression ratio can be defined as the ratio of the original image size to the compressed image size:
?? = ?? i ?? o (6)Here is the matrix of performance for wavelets db3, haar, coif3, sym3, where T c -time for compression, T d -time for decomposition. Fig. 9 shows a comparative analysis of the compression ratio for wavelets db3, haar, coif3, and sym3. The results show that the wavelet Haar transform provides better compression.
8. Conclusion
The article offers a hybrid compression algorithm for various types of images. Wavelet transformation, Walsh transform, and arithmetic coding are used together to obtain the best results, such as at least 39 times compression, without loss of quality in decoding. The performance evaluation is based on signal/noise ratio, standard deviation, and compression ratio. The quality of the restored image matched the quality of the original. The proposed algorithm can be used in many areas, as image transmission has become an integral part ofeveryday life.

![Fig. 8: Reconstructed image PSNR[5] reflects the quality of the reconstructed image and indicates the effectiveness of the compression algorithm. The MSE standard error is the average error value between the input image I and the compressed one I`:](https://computerresearch.org/index.php/computer/article/download/102301/version/102301/1-Image-Compression-using-Walsh-Functions_html/41272/image-7.png)

| Input image | PSNR | MSE | T c | Td | Compression coefficient K |
| db3 | |||||
| 1 | 48,474987 | 3,72 | 7,677057 | 10,637286 | 51,32578 |
| 2 | 47,636765 | 4,39 | 7,793296 | 10,553187 | 47,42396 |
| 3 | 49,512393 | 2,93 | 7,220063 | 10,377102 | 55,23157 |
| 4 | 48,952306 | 3,34 | 7,817294 | 10,865413 | 49,97539 |
| 5 | 47,940439 | 4,21 | 7,995294 | 10,950095 | 47,12561 |
| 6 | 45,629887 | 4,38 | 6,365905 | 8,198367 | 38,85647 |
| haar | |||||
| 1 | 47,42677 | 4,74 | 7,162271 | 10,23863 | 54,13286 |
| 2 | 46,94007 | 5,30 | 7,581140 | 10,39107 | 50,97951 |
| 3 | 48,24472 | 3,93 | 6,926179 | 9,885088 | 59,79658 |
| 4 | 47,81663 | 4,33 | 7,422946 | 10,30475 | 52,48647 |
| 5 | 47,37572 | 4,80 | 7,536443 | 10,31744 | 51,89783 |
| 6 | 43,57184 | 7,03 | 5,811217 | 7,750165 | 39,25239 |
| coif3 | |||||
| 1 | 48,99345 | 3,31 | 7,896789 | 11,26030 | 53,18951 |
| 2 | 48,03012 | 4,13 | 7,909564 | 11,13821 | 50,20183 |
| 3 | 49,70579 | 2,81 | 7,405461 | 11,05338 | 58,76425 |
| 4 | 49,40175 | 3,01 | 7,988354 | 11,30202 | 53,37582 |
| 5 | 48,27024 | 3,90 | 8,155997 | 11,57530 | 50,09869 |
| 6 | 44,86736 | 5,22 | 6,785390 | 8,942609 | 34,75683 |
| sym3 | |||||
| 1 | 48,47499 | 3,72 | 7,658239 | 10,72807 | 51,15623 |
| 2 | 47,76368 | 4,39 | 7,815626 | 10,55944 | 47,16854 |
| 3 | 49,51239 | 2,93 | 7,620959 | 10,52366 | 54,99863 |
| 4 | 48,95231 | 3,34 | 7,926224 | 10,85511 | 50,08605 |
| 5 | 47,94044 | 4,21 | 8,008160 | 10,86697 | 47,38945 |
| 6 | 45,62989 | 4,38 | 6,184347 | 8,135875 | 38,67824 |