1. Introduction
2. R Tool
R is a free software environment for statistical computing and graphics. It compiles and runs on a wide variety of UNIX platforms, Windows and Mac OS [12] R is public domain software primarily used for statistical analysis and graphic techniques [10]. A core set of packages is included with the installation of R, with more than 7,801 additional packages (as of January 2016[update]) available at the Comprehensive R Archive Network (CRAN), Bio conductor, Omegahat, Git Hub, and other repositories. [14] R tool provides a wide class of statistical that includes classical statistical tests, linear and nonlinear modeling, classification, timeseries analysis, clustering and various graphical functions. [13] R uses collections of packages to perform different functions [11]. CRAN project views provide numerous packages to different users according to their taste. R package contain different functions for data mining approaches. This paper compares various clustering algorithms on datasets using R which will be useful for researchers working on medical data and biological data as well. For this IDE, R Studio is used refer the below Figure 1.
17 Year 2016 ( ) C luster analysis divides data into meaning full groups (clusters) which share common characteristics i.e. same cluster are similar to each other than those in other clusters. It is the study of automatically finding classes. A web page especially news articles which are flooded in the internet have to be grouped. The clustering of these different groups is a step forward towards the automation process, which requires many fields, including web search engines, web robots and data analysis.
Any new web page goes through numerous phases including data acquisition, preprocessing, Feature extraction, classification and post processing into the database. Cluster analysis can be regarded as a form of the classification which creates a labeling of objects with class labels. However it derives these labels only from the data. Data mining functionalities are the Characterization and discrimination, mining frequent patterns, association, correlation, classification and prediction, cluster analysis, outlier analysis and evolution analysis [1].
Clustering is a vivid method. The solution is not exclusive and it firmly depends upon the analysts' choices. Clustering always provides groups or clusters, even if there is no predefined structure. While applying cluster analysis we are contemplating that the groups exist. But this speculation may be false. The outcome of clustering should never be generalized. [9].
3. Clustering Algorithms a) K-Means
The term "k-means" was first used by James Macqueen in 1967 [2], though the idea goes back to 1957 [4]. The K-means algorithm is the most commonly used and simplest method among all partitional clustering algorithms. As Harington and Wong1979 mentioned it is an iterative method which minimizes the sum of the squares for a given number of Clusters. Here's how the algorithm works [5]: 1. Select k points as initial centroids. 2. Repeat 3. From K clusters by assigning each point to its closest centroid. 4. Recompute the centroid of each cluster. 5. Until centroids do not change.
K-Means reaches a state in which no points are shifting from one cluster to another e.g. repeating until only 1% of the points change clusters.
For measuring the quality of the clustering we measure Sum of the squared error (SSE) or scatter.
SSE=? ? ????????(?? ?? , x) 2 ????? ?? ?? ??=1Where dist is standard Euclidean distance between two objects in Euclidean space. The centroid (mean) of the ith cluster that minimizes the SSE is defined as
? ? ????????(?? ?? , x) 2 ????? ?? ?? ??=1The advantage of this method is highly scalable of the huge sum of data sets with O(n * k * r) where r is the number of rounds, where n represent number of data items, k represent numbers of clusters [14]. It has user defined constant K and Runtime is totally dependent on the initial pick of centroids.
4. b) K-Means Implementation using R
For this analysis we have considered Online News Popularity datasets which consists of articles published by Mash able (www.mashable.com) [4]. Instances are 39797 and Number of Attributes is 61. As the results of the k means are undeterministic, we have followed the practice of running multiple rounds of k means so performed on various k values as k=3, k=5 and k=10. The best iteration is one who minimizes the average distance of each point to its assigned centroid.
5. Fig 2 : K means plot with k=5
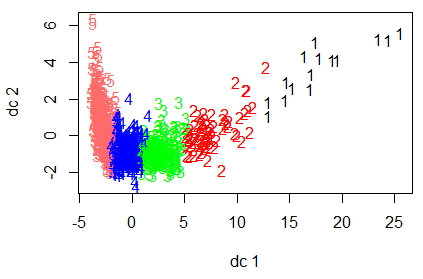
The Figure 2 shows the results of clustering the Online News Popularity datasets with 39645 number of News articles URL's. The above results show that there is overlapping of clusters. So preprocessing is required to address this problem and omit the NA values also. Then the following is the code after data cleaning [15] Available components [1] "cluster" "centers" "totss" "withinss" "tot.withinss" "betweenss" "size" [8] The results are showing the information about cluster means, clustering vector, sum of square by cluster and available components. The fpc package is used to draw the discriminant projection plot using Plotcluster function (Fig3).
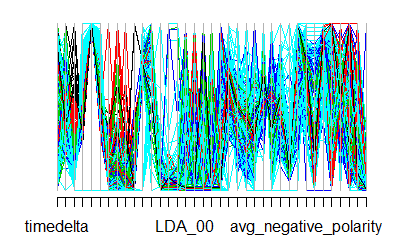
The result of plotting the class returned by function application is shown below. The Figure 4 shows the parallel coordinators plot to see the variables contributed in each cluster.
6. c) Fuzzy C-Means
Fuzzy c means clustering (FCM), each data point has a fraction of membership to each cluster. This algorithm works iteratively until no further clustering is possible. The membership fraction that minimizes the expected distance to each centroid has to be calculated.
The algorithm is very similar to K-Means, except that a matrix (row is each data point, column is each centroid, and each cell is the degree of membership) is used. 1. Initialize the membership matrix U 2. Repeat step (3), ( 4) until converge 3. Compute location of each centroid based on the weighted fraction of its member data point's location.
7. Update each cell as follows
Notice that the parameter m is the degree of fuzziness. The output is the matrix with each data point assigned a degree of membership to each centroids.
8. e) Hierarchical Clustering
Hierarchical Clustering a series of partitions takes place, which may run from a single cluster containing all objects to n clusters each containing a single object. This clustering builds a cluster hierarchy or, in other words, a tree of clusters, also known as a dendrogram [7]. Hierarchical algorithms can be further categorized into two kinds [3] i. Agglomerative clustering: This clustering starts with n clusters and iteratively merges the number of clusters which are most similar objects or clusters, respectively, until only one cluster is remaining (n ? 1).This requires the defining of closest proximity. ii. Divisive clustering: This clustering starts with one cluster and iteratively splits a cluster until singleton clusters of individual points remain, so that the heterogeneity is reduced as far as possible (1 ? n).This requires the decision of splitting at each step. The Hierarchical Clustering algorithm [6] below takes an n×n distance matrix d input and increasingly gives n different partitions of the data as the tree it outputs result. The largest partition has n single-element clusters, with every element forming its own cluster. The second-largest partition aggregates the two closest clusters from the largest partition, and thus has n ? 1 clusters. In general, the ith partition combines the two closest clusters from the (i ? 1)th partition and has (n ? i + 1) clusters. Because of the additional complexity of keeping data in a sorted list or heap, so the time required is O(m 2 log m) and Space required is O(m 2 ). In this approach, it compares all pairs of data points and merges the one with the closest distance. Algorithm 1: Compute the proximity matrix if necessary 2: repeat 3: Merge the closest two clusters. 4: Update the proximity matrix to reflect the proximity between the new cluster and initial cluster 5: Until only one cluster remains.
The Proximity (C i, Cj) of clusters C i and C j, which are of the size m i and m j ,respectively is expressed as
?????????????????? (?? ?? ,?? ?? ) = ? ?????????????????? (??,??) ????? ?? ?? ??? ?? ?? ?? * ?? ??The data set considered is micro RNA expressions. It is actually collected from Fresh paired tumor and control samples from the PAC (Periampullary Carcinoma) patients undergoing Whipple's pan creaticoduodenectomys Data Mining in Health Informatics [15] is an emerging discipline, concerned with developing methods for exploring the unique type of data that come from Health Care database > result$membership[1:3,] 1 2 3 management system. We have also considered the Iris dataset. The code for the implementation is given as follows [16] Figure 6 shows the results of clustering.
9. Fig. 6 : Hierarchical Clustering
The Authors [14 ] have also performed hierarchical clustering on PAC tumors dataset which are distinct from counterpart normal pancreas, normal duodenum, and normal distal CBD and normal ampulla. Unsupervised hierarchical cluster analysis of miRNA Expression profiles were clustered of PAC tumors into pancreatobiliary (n ¼ 23) and intestinal subtypes (n ¼ 17), while normal pancreas (n ¼ 22), normal duodenum (n ¼ 6), normal distal CBD (n ¼ 6) normal ampulla (n ¼ 6) are clustered as different entities (Figure 7). V.

![Within cluster sum of squares by cluster:[1] 3437391 3417672 3385646 3069653 3279165 (between_SS / total_SS = 92.1 %)](https://computerresearch.org/index.php/computer/article/download/1370/version/101029/4-Cluster-Analysis-of-Medical_html/18254/image-4.png)