1.
? Apache Spark promises speed up to 100 times faster than Hadoop MapReduce and comfortable APIs. ? Spark can run as a standalone or on top of Hadoop YARN, where it can read data directly from HDFS. ? Apache Spark processes data in-memory while Hadoop MapReduce persists back to the disk after a map or reduce action, so Spark should outperform Hadoop MapReduce. ? Spark has comfortable APIs for Java, Scala and Python, and also includes Spark SQL. Hadoop MapReduce, however, is written in Java and is infamous for being very difficult to program.
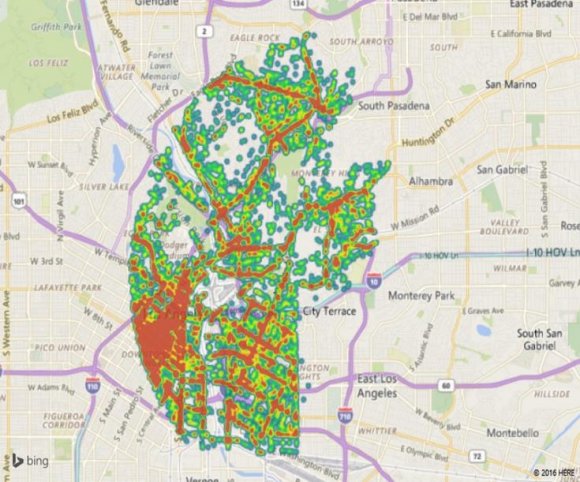
According to the Statewide Integrated Traffic Records System (SWITRS) there were a total of 173,715 collisions reported through the years 2009-2013 in the LA i.e. an average 34,745 number of collisions each year and around 95 collisions each day. Our analysis is primarily focused on SWITRS data for the years 2009-2013 for Los Angeles in order to provide insight into the types of collisions, areas with higher frequency of collisions, and time windows of high frequency collisions etc. This can potentially enable law enforcement divisions in crash apprehension, collision reduction, and in turn take proactive measures to control the collision rate and ensure safety of drivers and spread awareness among drivers.
Our dataset is large and unstructured. Hence, storing data in Hadoop Distributed File System was an option. But when compared we came down to a conclusion that Hadoop is scalable, but the programming API is lacking. Real-time streaming frameworks like Storm are a good fit for fixed processing from firehoses, but not so much for flexible queries from a data store. Thus, we have turned to Spark, a fast inmemory distributed computing framework, to help us with these insights. The utility of using Spark to consume large amounts of data and enable analytical insights is what we aim to demonstrate.
2. II. Related Work
Cameron [8] and Andrew et al [9] also performed a details analysis of crash data in their studies. The difference in our approach is that for our research we adopt big data techniques and principles for data analysis. It is not only to store and process massive data set but also faster to analyze such a massive data set using these techniques. Both papers will be discussed in detail below in terms of technology used, data source, etc.
First, we will discuss the Accident Data analysis done by Cameron. Cameron targeted the data set by breaking it down into several clusters. In this paper, clustering technique was used to divide data into several buckets like motorcycle, trucks, cars, pedestrians, etc. This clustering technique leaded to constructive analysis of the traffic data of Victoria, Europe. The analysis was focused around counter measurements (a measure that attempts to break the road trauma chain before happen) and target groups (which specifically targeted a segment of vehicle on the To analyze more than hundred thousand records we adopted Spark for faster processing of this massive data set. In this paper, we are presenting facts based on data and analytics which lead to conclusions like the number of collisions decreased between 2009 and 2013, Females involved in collisions were much less than males, etc. Moving ahead in our research, we addressed complex analytics like areas near CalStateLA more prone to collisions, brands of cars more involved in collisions and which specific type of collision was most observed.
3. I. Introduction
ig Data is defined as non-expensive frameworks that can store a large scale data and process it in parallel [9,10].
There are huge number of collisions reported around the world and the death and serious injury rates are significantly growing as indicated by statistics and evaluations published by different agencies across the world. Collisions can happen because of many reasons like alcohol, drugs, circumstances, inattentiveness, etc. We have used DataBricks Spark over Hadoop to analyze our data because of the following reasons: B road). A brilliant way to look at the problem and some great conclusions have been derived.
In comparison to Cameron's research this paper is targeting one of the busiest cities of the America in terms of traffic, Los Angeles. Apart from this, the main thought about the approach is different. This paper discusses about the level of severity, highest type of collision, gender analysis, etc. and not dividing data into segments of type of vehicle driven. Also, we have used Spark, a fast big data analytical tool that made processing much faster and efficient. We also used better graphical representations like 3-D maps and heat maps.
Another similar research study was done by Andrew who, unlike Cameron, divided hos data set into hot spots. Hots Spots means the areas where most collisions occurred like bridges, intersections, road segments to increase police awareness in those areas. This is similar to the approach we have adopted in this paper. Andrew's paper covers Tuscaloosa County, Alabama and they developed a new Geographic Information System which pointed hot spots in various areas of the Tuscaloosa County. On the contrary, we did not build any tool for analysis and showcasing real time change in information. We discussed the various factors that cause collision.
4. III. Our Big Data Systems
We have utilized the SWITRS 2009-2013 collision dataset [1] for Los Angeles city to do point by point examination on crash patterns, geographic occurrence, recurrence of collision and so on.
To add an alternate measurement to the investigation we considered California State University Los Angeles and Downtown Los Angeles as our point of convergence and continued to extend the information in light of various parameters like time and distance. This would bring about extricating key discoveries about crashes happening around our university and in Los Angeles.
We stored our unstructured data in the data bricks cluster. Data Bricks provides reliable and scalable storage for storing and analyzing unstructured data and also runs on the top of the Spark. The advantage of making use of the Spark is the In-Memory computation. Data stored in Data Bricks Cloud and can be queried using different programming languages, for our analysis we used iPython Notebook to extract the data as it provides an SQL-like structure and operates on tables just like an RDBMS, even though it does not strictly follow the full SQL standard.
We have used Data Bricks for our analysis as one of the advantages provided by Data Bricks is a cluster that can be launched, dynamically scaled up or down, and terminated with just a few clicks. One other key advantage is the ability to importing data seamlessly
5. IV. Collision Data Analysis in Spark
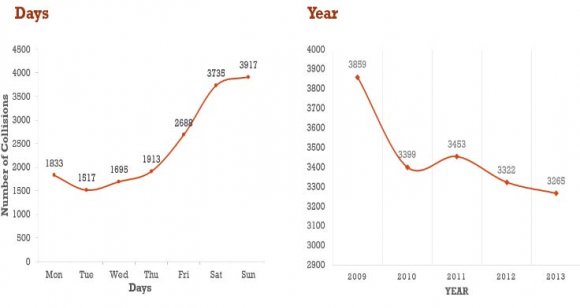
It was observed that there was a decrease in total number of collisions reported from 2009 till 2013 and this can be seen in Figure 1.
Further that in Figure 2 shows that from all the kind of collisions reported, the most kind of collisions which were committed were broadside collisions followed by Rear side collisions, Sideswipe and Hit object as shown in the graph below:
6. b) Graphical representations of data analyzing results
The other important parameters in our analysis were day and time in Figure 3, where we analyzed collisions that occurred each day and for every two-hour interval. We observed that collisions were higher between Friday and Monday than the rest of the days.
7. Figure 3: Day analysis of Collisions Reported
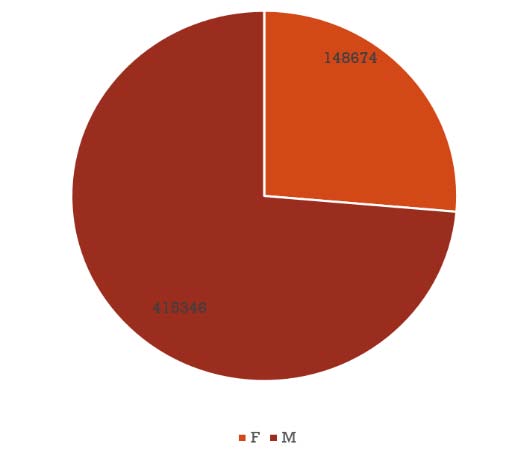
Another thing to observe was that the most number of collisions were reported during 12:00 PM to 8:00 PM where peak time of collisions is between 2PM to 6PM. The least is during 4:00 AM to 6:00 AM. This is shown in Figure 4. We performed Gender wise analysis as well and found that 60% of the collisions that were reported had a male driver driving the car, in only 40% of the cases women drivers were driving the car as shown in Figure 5.
8. Figure 5: Gender Wise Collision Analysis
Our data set included a column for age of parties involved in collisions and we extracted this data to include another measurement for age wise analysis of collisions.
The different age groups data covered by the data set was identifies to varied and ranging between infants and senior citizens. When the entire age group data was analyzed, we found that most parties that were involved in the collisions were between the age of 20-30. Results also did not leave any uncertainty and demonstrated that youth was clearly involved in most collisions which can be seen in Figure 6.
9. H
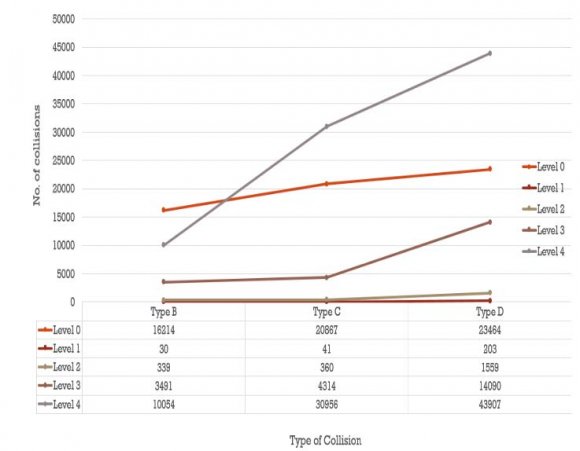
It was insightful to perform a level of severity analysis and it was interesting to find that collisions that have been reported over the years were either at level 4 of severity or at level 0 which means either fatal or mere property damage which are both extreme cases. The Figure 7: below shows this analysis. We also did a car wise analysis to see which cars were most involved in collisions and to make it interesting we bifurcated the cars into consumer segment (which are affordable and seen on the road more) and the luxury section (which are expensive cars). It was interesting to find that Toyota being most loved as a car actually was involved in most collisions followed by Ford and Honda in the consumer segment as seen in Alcohol is a concern associated with driving and collisions world-wide. Based on our analysis, we see that driving under the influence of alcohol involved more severe collisions though he number of collisions under the influence of alcohol have decreased since 2009 which is a good sign but the number is still high standing at around 3265 collisions in 2013 as illustrated in Figure 11. As per our analysis Figure 11 shows that weekends were prone to having collisions involving alcohol as compare to rest of the week.
10. Global Journal of Computer and Technology
Volume XVI Issue IV Version I 4 Year 2016
11. ( )
Figure 12 shows as per the collision rate analysis approximately 34% of the cases were Critical in terms of level of severity when alcohol was involved in the situation of collision.
12. Table 1: Level of Severity
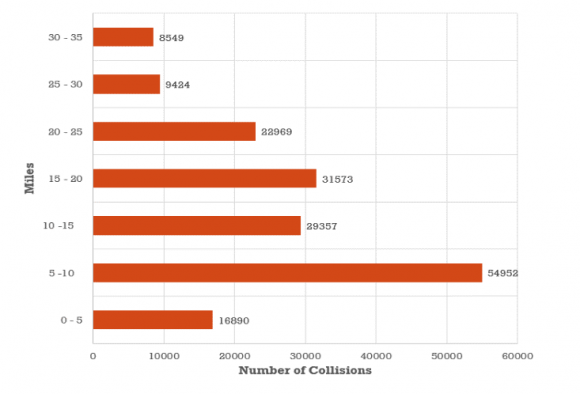
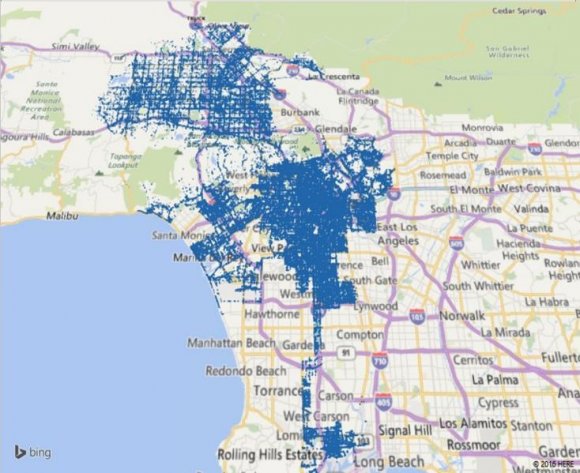
Figure 12: Collision Severity under the influence of alcohol We took our university as a focal point and calculated the distance to every collision reported from our university, we found that the most of number of crimes were committed within the radius of 5-10 miles. Clearly, Figure 13 indicates that within 10 miles of our campus there are more collision incidents then areas far around.
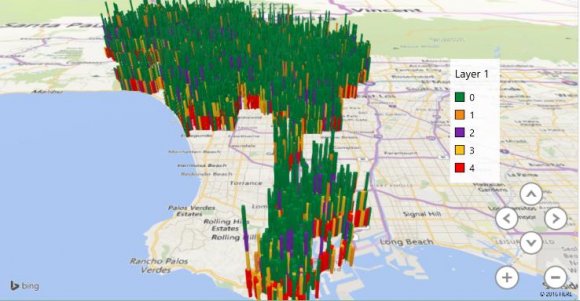
13. 3-D Maps
Our visualization tool has the ability to make data visualization a lot more interactive. One such powerful feature of the tool is the 3D maps which present results on a multidimensional or perhaps to present geo spatial data. We decided to utilize this feature and create 3D map for the degree of severity of injury (refer Table 1) shown in Figure 18 As per the analysis, Figure 16 shows more male drivers being involved in severe fatal collisions as compared to female drivers (Refer Table 1)
To make the map more readable in terms of what the maps are trying to symbolize, we decided to focus on the Long Beach area which is a coastal city of the Los Angeles county and a port in Southern California. The graph shows the different levels of severity of collisions that occurred on a geo location, Figure 19 and 20 shown below describe these:
14. V. Conclusion
In this paper we have adopt the approach to leverage the Data Bricks and its Spark platforms for big data analysis. We have queried the data stored in Data Bricks cloud and using the iPython Notebook to query the data. Also we used Databricks and its benefits when compared to Hadoop which has more limitations.
In our detailed analysis, we were able to project and visualize data about collisions that occurred in Los Angeles. Through our analysis we found that:
1. Collisions have decreased each year from 2009 to 2013. 2. Collisions are higher between Friday and Monday than the rest of the days. 3. Most collisions occur between the time brackets of 12PM to 8PM where peak 4. Time of collisions is between 2PM to 6PM. 5. Broadside collisions occur more than other kind of collisions.
6. The age group of 20-30 is most involved in collisions. 7. Male drivers cause more collisions than female drivers. To be specific the ratio is 60:40. 8. 49% all collisions reported are critical and have been rated level 4 in terms of severity.
| Abstract-Police say alcohol, drugs and speed are the three | |
| major factors that cause collisions, we thought that it would be | |
| insightful to analyze the collision data to ensure the correctness of this conclusion; and also to get further information like what age groups were involved, in what areas have accidents occurred, what were the reasons behind collisions, etc. These experiences can possibly make overall | Year 2016 |
| population mindful of the reasons for crashes created by | 1 |
| impacts. | |
| ( ) H |