1. Introduction
uman Brain is the core processing unit which controls the functionality of the whole body. The human brain is a complex structure of billions of neurons. Our brain cells produce pulses and vibrations. This electrical activity of our brain is one of the most signifying factors in understanding how the brain functions. EEG (Electroencephalogram) signals of the brain can be used to monitor neural activities [1]. EEG records electrical activity over areas of the scalp. The brain produces different electrical waves over different levels of consciousness of the brain.
In the past, EEG signals were analyzed using traditional methods [2]. However, the diversity of the EEG signal could not be possibly mapped by using the linear analytical procedure. So later came techniques like Fourier transform were used for analyzing power spectral density and frequency components. Wavelet decomposition is a much better tool for analyzing EEG signals which provide signal denoising. Because of the transient characteristic of EEG data, a wavelet is a more effective analytical tool in this case.
Wavelet entropy is perhaps one of the most defining factors to consider when analyzing the level of consciousness of the human brain. Suppression in EEG signals could mean possible loss of responsiveness over a period [3]. So for anesthesiological applications, wavelet entropy of EEG signals could be considered as an important factor.
Anesthesia is a medical process extensively used in hypnosis, analgesia, muscle relaxation, etc. So the necessity to maintain the transparent, precise and consistent level in a medical coma is of much importance in the biomedical world. EEG has drawn much attention as a clinical monitoring tool for anesthesiological applications.
Also, there is a need for sophisticated analysis of EEG signals in the field of medical diagnoses like brain tumor identification or characterization of epileptic seizures. Several pathological or cognitive events can be diagnosed in the EEG spectrum.
2. II.
3. Literature Review
EEG signals were first recorded in 1924. Since then, the analysis of this signal has been a developing interest. EEG signals are much complex with a multitude of frequencies and patterns.
Neuro-physiologists have defined distinct frequency bands and corresponding physiological activities in EEG signal. Traditionally used linear systems of EEG analysis proved to be inept in modeling such a dynamic system like brain [2]. Then with the advent of non-linear signal processing techniques like Fourier transform were used. However, Fourier transform does not provide efficient analysis of non-stationary signals like EEG. Since then wavelet is an excellent tool for analyzing EEG data [4].
4. a) Wavelets & Entropy Measures
For analyzing transient signals, wavelet decomposition is the most popular choice. A wavelet is wave-like oscillations of limited duration. Wavelet transforms an existing signal into another form by translation and dilation [5].
Entropy provides the average unpredictability of a random variable which is equal to the information content in a composite signal [6]. Claude Shannon was the first one to come up with the definition of entropy. That's why Shannon's entropy is mostly used in finding entropy of a given discrete signal.
? ?2 ? 3.4 3.5 ? ?1 ? 5.4Theta, ? (4-8 Hz): appears during drowsiness and sleep in normal adults, otherwise high theta activity in awake state suggests abnormal and pathological conditions 5.4 ? ?2 ? 7.4 7.4 ??1 ? 9.9
Alpha, ? (8-14 Hz): appears during relaxed and mentally inactive awakeness.Amplitude mostly <50 µV, and appears most prominent in occipital area 9.9 ? ?2 ? 12.4 12.5 ? ?1 ? 17.9
Beta, ? (14-30): present in front central region with less amplitude than alpha rhythms.Enhanced by expectancy states and tension. 18 ? ?2 ? 23.9
24.0 ? ?3 Gamma, ?(>30): have high frequency band and usually not of clinical and psychological interests, and therefore often filtered out in EEG recordings.
Shannon entropy H is given by the formula
H=-? ?? ?? log ?? ?? ??Where p i is the probability of character number i showing up in a stream of characters.
Besides, Shannon's Entropy measurement several other entropy measurements are there such as Log Energy Entropy (LogEn) and Threshold Entropy Measurement.
5. b) Characteristics of Anesthesia
Anesthesia is a temporary state of unconsciousness. [7] [8] Anesthesia is used in medical procedures for lack of pain and muscle relaxation to enable medical intervention in human bodies. Anesthesia thus has several different levels. Anesthesia levels correspond to the level of consciousness. [9] [10] [11] The different phases of anesthesia levels include induction, the excitement phase, surgical anesthetic stage, and an overdose. Each of these stages affects the EEG signal in different ways. [12] [13] [14] In our work we have assumed five levels of anesthesia ranging from 1 to 5 each corresponding to anesthesia levels in an ascending manner.
6. c) The outcome of Literature Survey
Analyzing EEG signals using a traditional linear methodology or even conventional Fourier transform does not give complete information of signal's characteristics. Wavelet analysis on such diverse transient signal components is too quite troublesome for getting efficient features [15]. That is why using wavelet entropy could provide the expected value of information from a given signal. But to characterize EEG signals to the point of making it an analyzing factor in identifying anesthetic stages like induction, exciting stage, surgical anesthesia, and overdose, we need the use of artificial intelligence. Using feed-forward neural network with back propagation could provide the much-needed pattern recognition in the EEG spectrum for identifying the level of consciousness.
7. III.
8. Methodology
In this work, we have used organized EEG data where each EEG signal is mapped to the level of anesthesia stages. We grouped our data into 300 samples of EEG signal in the matrix. Each signal is of 250 Hz and has a duration of 10s.
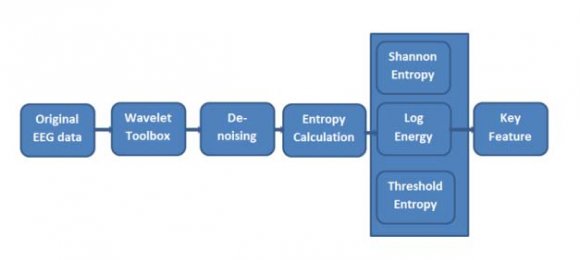
9. a) Key Feature Selection
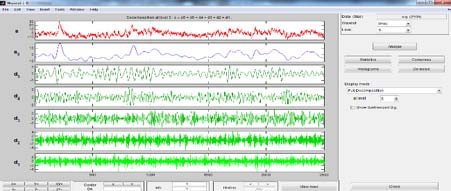
The approach of obtaining a key feature from EEG data is the most crucial part. The whole procedure is based upon the fundamental concepts mentioned in chapter 2. Firstly, the obtained EEG signals are loaded in the wavelet toolbox for analyzing. The signals are denoised using the created m-function written in the Matlab. After Denoising signals we need to extract features from those signals. We have chosen entropy measurements as our characterizing feature for EEG data. the wavelet. We are dealing with 1-D EEG signals which are band-limited. Since Meyer wavelets match any band-limited signal very well [16], we have chosen 'dmey' as our mother wavelet. The discrete 'meyer' wave also shows infinite regularity [17]. However other mother wavelets can also be used.
10. c) Wavelet Entropy Calculation
Wavelet entropy is a measure of the unpredictability of information content. It shows the degree of order or disorder in an energy spectrum. Therefore, wavelet entropy can provide useful information about the underlying dynamic process associated with the signal.
The wavelet entropy is used as the key feature of our EEG data analysis. We have used three entropy measurements namely the Shannon Entropy, log energy entropy and the threshold entropy.
The Shannon entropy is given by the formula:
??1(?? ?? ) = ?? ?? 2 log ???? 2 so ??1(??) = ? ? ?? ?? 2 log ?? ??2The log energy entropy [18] can be calculated as such:
??3(?? ?? ) = log ?? ?? 2 ??3(??) = ? ? log ?? ?? 2 ??The threshold entropy is computed by: E4(si) = 1 if |si| >p and 0 elsewhere so, E4(si) = #{i such that |si | >p} is the number of time instants when the signal is greater than a threshold p.
11. d) Pattern Recognition Network
The acquired key features are concatenated with one another for providing multi-layer input in the pattern recognition network. Also, each entropy measure can be given separately into the input layer. In both cases additional factors like age of the patient etc. can be added for multi-layer input data in the pattern recognition network. [19] [20] Choosing the number of hidden layer in the pattern recognition network is a critical decision. The target vector contains a value within range 1 to 5. The higher the level of anesthesia, the higher the target values. The target value is compared with the output vector in the output layer. The comparison is used to compute the mean squared error (MSE). The error is propagated backward to adjust weights and biases of the neural network. MSE value gradually decreases over the training phases. [17] IV.
12. Result and Analysis
Here we present the results of our works and the analysis of our findings.
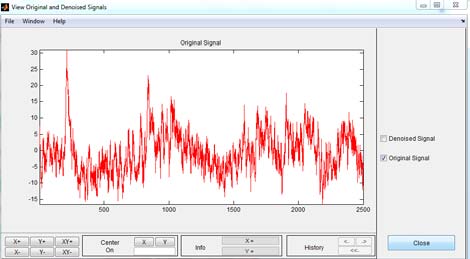
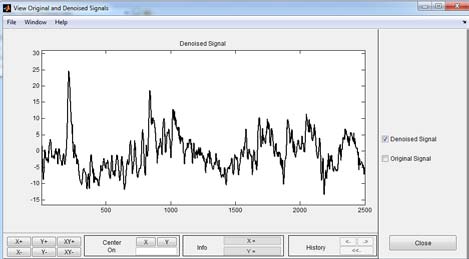
The original signals are denoised using discrete 'Meyer' wavelet at level 5. Then the entropy value is computed from the denoised signal. The Shannon Entropy, Log Energy Entropy and Threshold Entropy values are used as the feature for the next phase of classification.
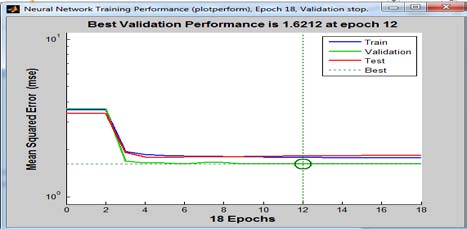
We choose a pattern recognition network with four input layers, four hidden layers, and one output layer. We have tested the neural network with distinct numbers of hidden layers, and the optimized number is chosen to be four.
The performance of the pattern recognition network is quite satisfying. We have given Shannon's entropy, log energy entropy, and threshold entropy as the feature values for the target data which was used to train the neural network. V.
13. Conclusion
This paper elucidates an approach in analyzing EEG signal with the goal of identification of anesthesia levels. Wavelet entropy calculation shows how this highly diverse non-linear EEG signals can be simply measured. The work depicts a suitable method by combining wavelet entropy and artificial neural networks for classifying transitions in the EEG signals under anesthesia.
| ( ) D |