1. Introduction
s technology development has taken on all aspects of life, the world of transportation is witnessing a major revolution due to the emergence of self-driving cars. The emergence of selfdriving cars attracted the attention of the media as well as individuals in it. Brandon Schoettle and Michael Sivak, (2014) stated that the emergence of self-driving cars attracted people and researchers as well who aim to explore people's perception of self-driving car. Researchers as well aim to explore how reliable the selfdriving car is and what benefits the user may got when using this type of car. Self-driving car as defined by Daniel Howard and Danielle Dai, (2013) is an automated vehicle that has the ability to drive and move without human involvement. Self-driving car system is powerful, it is equipped as well with tools and resources that allow it to sense the world around it.
The adoption of self-driving cars may be necessary duo to many reasons related to regular transportation system and pollution as well. It is expected that self-driving cars would have great impact on transportation system by reducing car accidents, respecting road rules, reaching destinations fast and reducing traffic jams. Self-driving cars as well expected to reduce emissions which positively impacted environment. Old peoples and people who cannot drive may depend on self-driving cars for reaching their destinations as stated by Corey D.Harper, Chris T.Hendrickson, Sonia Mangones, Constantine Samaras, (2016). Even though self-driving cars expected to have lots of benefits and its features claimed to be extraordinary; it is essential to explore the people's intention to turn into using such car type.
The UAE is one of the best countries in the world in the adoption of technology in all aspects of life. UAE government is turned into smart government, the schools adopt smart learning methodologies and the UAE people rely on the use of technology in almost their daily transactions. It is expected that the United Arab Emirates would be one of the leading countries to adopt the usage of self-driving cars. Although the self-driving cars may provide huge benefits to the user compared to the traditional cars that the user drive, the people perception to turn into using this type of cars may vary as some users prefer to engage in driving by themselves.
The aim of this research paper is to investigate the UAE people's intention to turn into using self-driving cars. This investigation is important for UAE government to explore UAE people's acceptance toward using autonomous cars and to take steps for the adoption of such cars in the future such as setting up regulations and preparing infrastructure as well, for this transportation revolution.
This research applied quantitative methods for collecting data based upon utilization of questionnaire that was prepared and sent for respondents living in United Arab Emirates.
Study Design: the research organized starting by the first section which is the introduction of the research in which the researcher identified the topic as well as the purpose of the research. After that research problem statement identified in the second section. Third section is the research justification/theoretical background in which research papers discussed similar affect people's decision to use self-driving cars. The researcher as well aim to examine the standard Technology Acceptance Model in case of introducing self-driving car for public.
The UAE is seeking the first position in all fields. One of the most important areas of interest to the Government of the United Arab Emirates is the technological field. The Government of the United Arab Emirates has become a smart government and technology is being applied in most of the life's aspects, which has established great acceptance to the transformation to technology among the people of the UAE. As the UAE continues to adopt international best practices in the field of technology, the revolution of using self-driving cars is expected to be supported by the Government of the United Arab Emirates. The adoption of self-driving cars requires investigating people's perception about this type of cars, it require as well exploring infrastructure requirements to adopt selfdriving cars, New road regulations must be set in order to adopt self-driving cars. But before taking any of the previously mentioned steps, it is essential to explore the UAE people's intention to turn into using self-driving car.
Existing researches deals mostly with people perception to autonomous cars, and some case studies conducted in in USA states and other countries to measure people's intention toward using autonomous cars. This research paper aim to fulfil the gap of measuring UAE people' intention to turn into using selfdriving car. The standard Technology Acceptance Model slightly modified by adding new constructs in order to measure the most common factors that affects UAE people's intention to turn into using self-driving cars.
for the government of United Arab Emirates in order to explore UAE people's acceptance to turn into using autonomous cars and to take steps for autonomous cars adoption in the future such as setting up new road regulations and preparing infrastructure as well, for this transportation revolution.
2. III.
3. Research Justification/ Theoretical Background a) Autonomous self-driving car
As technology development has taken on all aspects of life, we are witnessing a revolution in various means of transportation. One of the most important example of transportation revolution is the emergence of self-driving cars.Brandon Schoettle and Michael Sivak, (2014) stated that the emergence of self-driving cars gain the interest of many people as well as researchers who were interested in measuring the people's perception of such car. The Media as well was interested in self-driving car topic as it takes part of their reports and news.
? 0: No Automation: Driver is completely responsible about driving. ? 1: Function-specific Automation: One or more of the control functions can be automated but they operated independently of each other and the driver is fully responsible about driving. ? 2: Combined Function Automation: Minimally two of the control functions can be automated and work together, and driver may have time to take hands and feet off the control. ? 3: Limited Self-Driving Automation: Automated car but the driver is expected to participate in driving when it is needed i.e. driving control will be shifted to the driver in some situations. ? 4: Full Self-Driving Automation: Driver will not participate in driving just will provide the destination.
b) The need for self-driving car When considering the current transportation system, there are many problems that governments seek to find solutions for such as traffic congestion and air pollution resulting from the emissions of carbon dioxide from cars. one of the suggested solutions is the adoption of smart cars i.e. self-driving cars.
With the emergence of self-driving cars and people's interest in them, this important question comes to our minds, is there a need for this type of cars? There are many reasons to adopt the idea of self-driving cars. Matja?Knez, Matev?Obrecht, (2019) stated that the car registration worldwide increased sharply year after year, and this increase directly affect the environment and raising the air pollution since most of these cars are fuelbased cars.Self-driving car is smart car some of these cars are fuel-based and some others are electric-based. The use of self-driving cars would give the users the opportunity to reach their destinations faster which may reduce the driving time hence reduce emissions. Daniel Howard and Danielle Dai, (2013) explained how selfdriving cars depends on Intelligent Transportation Systems (ITS) that provides high safety level and smart calculation for best road to reach destination. The use of smart transportation system will result in reducing traffic jams, reducing car accidents hence saving lives and reducing emissions hence reducing air pollution.
Corey D.Harper, Chris T.Hendrickson, Sonia Mangones, Constantine Samaras, (2016) stated that people with disabilities, old people as well as people that are not driving due to medical problems consider the self-driving car as a solution for them to reach their destinations hence there is an increase need for such cars. From what is mentioned earlier, it is clear that there is an increasing need for self-driving cars.
4. c) Benefits of self-driving car
Brandon Schoettle and Michael Sivak, (2015) believed that it is expected that the self-driving cars would provide great benefits to the users. It is expected that the self-driving cars will provide comfortability compared to traditional cars that the human drive which may result in increased of traveling and mobility. It is expected as well that the self-driving cars reduce traffic jams and provide high standards of safety. Michael A. Nees, (2016) stated as well that the self-driving cars would increase the safety and reduce traffic problems. Michael A. Nees, (2016) believed that self-driving cars would allow the users of the car to take benefits of the road time.
Ward C., Raue M., Lee C., D'Ambrosio L., Coughlin J.F, (2017) agrees on the benefits mentioned earlier that self-driving cars have great benefits such as reducing traveling time, reducing traffic jams, reducing car accidents and allowing the users to take benefits of the travelling time.
Yu Shi, Jiefeng Chen, Qi Li, (2017) studied how the use of self-driving cars effects the capacity of the traffic and found that the cooperation of self-driving cars will results in raising traffic capacity, researchers as well stated that self-driving cars are efficient is speeding up the traffic flows.
Self-driving cars would provide great transportation solution for people with disabilities, old people as well as people that are not driving due to medical problems as mentioned by Corey D.Harper, Chris T.Hendrickson, Sonia Mangones, Constantine Samaras, (2016).
When reviewing the benefits mentioned earlier, benefits of self-driving cars can be concluded as:
? Self-driving car expected to provide high safety as it respects road rules and will reduce the accidents that are due to human errors. ? The self-driving cars give the user the opportunity to take benefits of roads times. ? Self-driving car tends to provide comfort to the user of the car which can lead to increase in the travelling and mobility. ? Self-driving cars would have great impact on traffic system as it will reduce traffic jams and raise the traffic flows especially at peak-hours. ? Self-driving cars will reduce the transportation time as it will give the users the chance to reach destinations faster and as a result the fuel consumption will be reduced as well as the emissions from the cars will be reduced and that will have positive impacts on the environment. ? Self-driving car could be perfect transportation method especially for people with disabilities, old people and people that cannot drive due to medical problems.
5. d) Challenges for self-driving car adoption
Brandon Schoettle and Michael Sivak, (2014) mentioned how it is important to set new traffic regulations that consider self-driving cars. Michael A. Nees, (2016) raised an important challenge when start using self-driving cars as that type of cars may share the roads with traditional cars that the human drive and this may provide unexpected results.
Michael A. Nees, (2016) believed that the ideal prototype of the self-driving cars that has been advertised may not actually materialize when self-driving cars widely used in real world and this challenge may have negative impacts on public.
Daniel Howard and Danielle Dai, (2013)stated that despite that the self-driving cars planned to be more efficient and sustainable as well it is assumed that is would be a safe car, the perception of public to turn into using self-driving cars may be challenging as public concerned about the real safety and liability the selfdriving cars that will be provided in real world. Researchers as well mentioned the manufacturing cost as a challenge as it is expected that self-driving cars would be of high cost for users to own and for government to adapt the road infrastructure for the use of such cars.
M. König, L. Neumayr, (2016) raised the uncertainty challenge for the adoption of self-driving cars as researchers mentioned how people as well as stakeholders may resist to adopt such cars because of their opinions about car's uncertainty. Researchers as well mentioned the people's resistance to change and caution's to "new thing" as a big challenge for the adoption of self-driving cars. One more challenge raised by the researchers that some people drive for pleasure and racing purposes; those people may resist to turn into using self-driving cars.
Frank Douma and Sarah Aue Palodichuk, (2012) stated that self-driving cars may be target for hackers or terrorists. As self-driving cars route can be tracked easily; it is essential to consider the system security and privacy of the self-driving cars. People tend to care about their privacy hence securing the system of the self-driving cars is another challenge for the adoption of self-driving cars.
IV.
6. Research Questions
As been discussed in the previous sections, the research gab is to measure the people's intention to turn into using self-driving cars in United Arab Emirates. The objective of this research paper is to investigate the user's preferred specifications in self-driving cars and the relationship between self-driving car's features and the user's intention to turn into using self-driving car. The researcher as well aim to measure the difference between the male and females in their intention to turn into using self-driving car.
The emerge of self-driving cars attract0ed the interest of governments, car companies, researchers and people as well, surveys conducted in this field to report people's intention to use the self-driving cars.
The main research question to fulfil the gap is "To what extent people in United Arab Emirates have the intention to turn into using self-driving car?" This main research question will be addressed through the following research questions:
7. Q1:
To what extent UAE people care about specifications of the self-driving car? Q2: Does the specifications of the self-driving car impact the UAE people's intention to turn into using selfdriving car? Q3: Does the self-driving car's features impact the UAE people's intention to turn into using self-driving car? Q4: To what extent people in United Arab Emirates have the intention to turn into using self-driving car? Q5: Does the Gender factor have different impact on the intention to turn into using self-driving car? Q6: Does the Driving Experience factor have different impact on the intention to turn into using self-driving car? Q7: Does the Education Level factor associated with the intention to turn into using self-driving car? Q8: Does the Gender and Driving Experience associated? the self-driving car's features affect the user's decision and intention to use this type of cars. Thus, this research hypothesis that there is strong association between the self-driving car's features and people's intention to turn into using self-driving car. Author of this research paper stated the hypothesis of this research as following: H1: UAE people highly care about the specification of self-driving car H2: There is significant association between self-driving car's specifications and the UAE people's intention to turn into using self-driving car. H3: There is significant association between self-driving car's features and the UAE people's intention to turn into using self-driving car. H4: There is significant association between self-driving car's safety features and the UAE people's intention to turn into using self-driving car. H5: There is significant association between self-driving car's performance features and the UAE people's intention to turn into using self-driving car.
H6: There is significant association between self-driving car's Ease of Use features and the UAE people's intention to turn into using self-driving car. H7: There is significant association between self-driving car's Usefulness features and the UAE people's intention to turn into using self-driving car. H8: there is no significant difference between males and females in their intention to turn into using self-driving car. H9: Driving Experience have positive impact on the intention to turn into using self-driving car. H10: Level of Education is not associated with the intention to turn into using self-driving car. H11: there is significant association between gender and driving experience.
Research hypothesis associated with research questions: H1: UAE people highly care about the specification of self-driving car Q2: Does the specifications of the self-driving car impact the UAE people's intention to turn into using self-driving car?
H2: There is significant association between self-driving car's specifications and the UAE people's intention to turn into using self-driving car.
Q3: Does the self-driving car's features impact the UAE people's intention to turn into using self-driving car?
H3: There is significant association between self-driving car's features and the UAE people's intention to turn into using self-driving car. H4: There is significant association between self-driving car's safety features and the UAE people's intention to turn into using self-driving car. H5: There is significant association between self-driving car's performance features and the UAE people's intention to turn into using self-driving car.
H6: There is significant association between self-driving car's Ease of Use features and the UAE people's intention to turn into using self-driving car.
H7: There is significant association between self-driving car's Usefulness features and the UAE people's intention to turn into using self-driving car.
Q4: To what extent people in United Arab Emirates have the intention to turn into using self-driving car?
H8: People in United Arab Emirates have great intention to turn into using self-driving car. H9: there is no significant difference between males and females in their intention to turn into using self-driving car.
Q6: Does the Driving Experience factor have different impact on the intention to turn into using self-driving car? H10: Driving Experience have positive impact on the intention to turn into using self-driving car.
Q7: Does the Education Level factor associated with the intention to turn into using self-driving car?
H11: Level of Education is not associated with the intention to turn into using self-driving car.
Q8: Does the Gender and Driving Experience associated?
H12: there is significant association between gender and driving experience.
The hypothesis above are tested utilizing bivariate correlation and Regression and other statistical tests. Sections below define the methodology and discuss the results found.
Technology Acceptance Model (TAM) utilized as basis for developing conceptual model for this In this research paper, researcher identified two factors that affects user's intention to turn into using self-driving car i.e. specifications and features of self-driving car. Researcher aim to investigate whether the UAE people care about self-driving car specifications when intending to buy a car and to what extent they care about these specifications. Researcher identified the specifications as the information, facts and important details about the self-driving cars that most of the regular car companies displayed and proposed for the customers. These specifications are real and available in regular cars as well, such as: system, car outside look, wheels, braking system, engine, luxury and comfort, entertainment, number of passengers and seating. The second factor that is identified by the researcher and affect the intention to turn into using self-driving car is the features of the car. Researcher identified features based upon the Technology Acceptance Model as it consists of the Ease of Use features, Usefulness features and researcher added the safety and performance features as well, as presented by Figure 2
8. Methodology
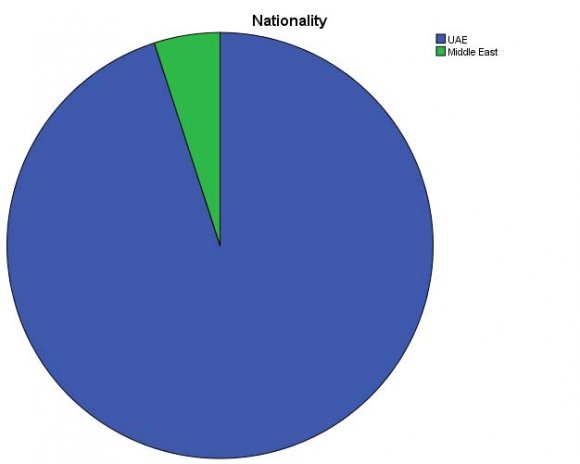
Data utilized in this research paper is gathered through online questionnaire. Before start responding to the questionnaire, respondents must read brief description about the self-driving car. The questionnaire consists of four sections, the first section consists of five demographics i.e. age, gender, level of education, nationality and driving experience, the second section is to measure respondent's interest and care about the self-driving car's specifications, the third section is about self-driving car's features, and the forth section is to measure the respondent's intention to turn into using self-driving car. Questionnaire utilizes seven-point scales. The questionnaire is included in Appendix A.
The questionnaire was sent to number of respondents for testing and checking the accuracy of the questions as well as evaluating the clearness of the questions. The targeted population of the questionnaire is people in United Arab Emirates.
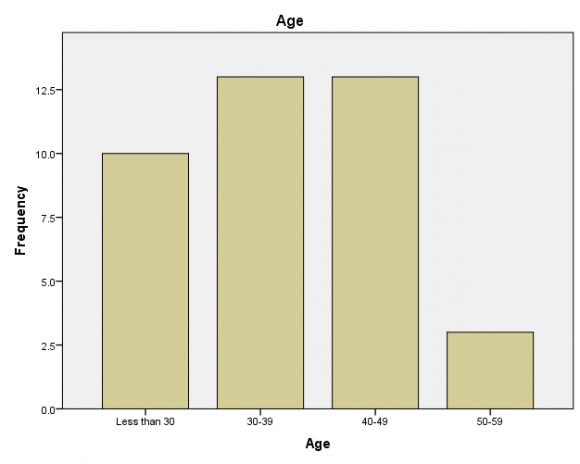
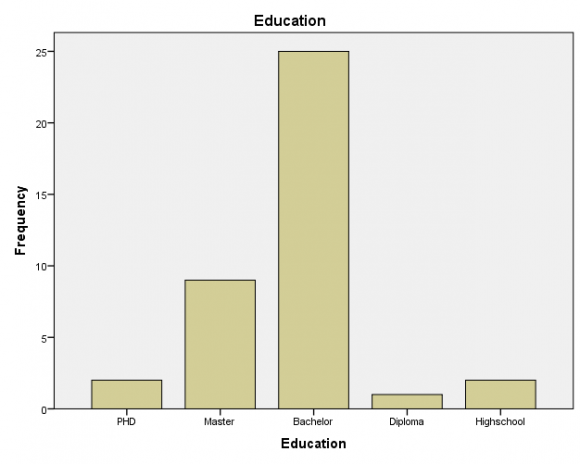
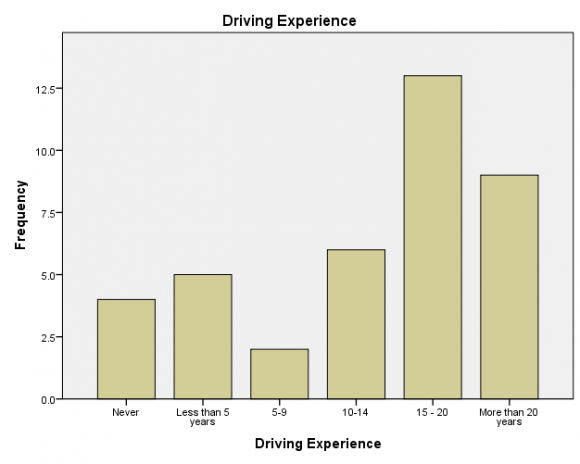
After testing the questionnaire, the questionnaire has been sent into 50 persons and the number of collected responses was 39 responds. Number of males participated in answering the questionnaire was 20 persons, while number of females was 19 persons. The age of the respondents to the questionnaire is up to 59 years old, nobody of 60 years old or above participated in answering the questionnaire. Questionnaire was sent to people of different education levels, but most of the responses were from people holding bachelor's degree. Information about driving experience as well collected from respondents to investigate if the driving experience has impact of respondent's decision to turn into using self-driving car.
Research hypothesis were investigated through statistical experiments in order to answer the three main research questions. Before conducting experiments, it is essential to identify the dependent and independent variables for each of the research questions as follows:
? For the first research question:
Q1: To what extent UAE people care about specifications of the self-driving car? Dependent variables: user's interest in self-driving car's specification Independent variables: Self-Driving car specifications (comfort, luxury, wheels and tires, braking-system, outside look, steering, number of passengers, seating, entertainment, safety system, multi-view technologies, car engine, speed, complete autonomous driving system, partial autonomous driving system) Group: UAE people.
? For the second research question Q2: Does the specifications of the self-driving car impact the UAE people's intention to turn into using self-driving car? Dependent variable: user's intention to turn into using self-driving car Independent variable: self-driving car specifications (comfort, luxury, wheels and tires, braking-system, outside look, steering, number of passengers, seating, entertainment, safety system, multi-view technologies, car engine, speed, complete autonomous driving system, partial autonomous driving system) Group: UAE people.
? For the third research question Q3: Does the self-driving car's features impact the UAE people's intention to turn into using self-driving car? Dependent variable: user's intention to turn into using self-driving car Independent variable: self-driving car features (safety, performance, ease of use, benefits) Group: UAE people. The questionnaire questions uploaded into Google Forms to create online survey. Then the created survey was sent to the respondents. After gathering responses, file of responses was downloaded from Google Forms into SPSS software for analyzing results.
9. VI.
10. Data Analysis (Statistical Tests)
Responses were gathered and uploaded into SPSS software for data analysis purposes, number of statistical tests conducted as follows: Data was checked for common bias; results from Table 3 above show that data in this case loaded on 39 components, and the first component is only explained 26.550 variation of data, therefore there is no common bias in the collected data.
a) Constructii. Scale Validity In this research paper, the developed questionnaire utilizes 7-point Likert scales ranging from Agree Strongly to Disagree Strongly. It is essential to test the scales reliability to ensure the consistency of the questions of the questionnaire. Cronbach's Alpha is the important value to measure in the reliability test as it indicated how questions are interrelated in the questionnaire. The higher the value of Cronbach's Alpha, the more reliability of the scale. Below are tables for scale validity i.e. reliability test.
The basic statistical measures of the constructs (Mean and Standard Deviations) are illustrated in Table 4, Table 7 and Table 10. No missing data has been detected as seen that valid N=39 is similar for all. A reliability analysis was carried out. The scale covering 14 items i.e. construct's attributes. Cronbach's alpha in Table 5 showed the questionnaire to reach acceptable degree of reliability for the first construct i.e. self-driving car's specifications, Cronbach's Alpha (?)= 0.771 (Table5). Table 6 shows that most items appeared to be worthy of retention, resulting in a decrease in the alpha if deleted. Except two items i.e. P1V1comfort and P1V2 safety system, which would increase the alpha to ? = 0.796 and ? = 0.779. There is no need to delete these items since the ? = 0.771 which is high and the increase in Cronbach's Alpha if item deleted is not significant.
Reliability for self-driving car's features construct's variables: Table 9 shows that all items appeared to be worthy of retention, resulting in a decrease in the alpha if deleted.
Reliability for intention to turn into using selfdriving car construct's variables: A reliability analysis was carried out. The scale covering 6 items i.e. construct's variables. Cronbach's alpha in Table 11 showed the questionnaire to reach high degree of reliability for the third construct i.e. intention to turn into using self-driving car, ?= 0.942 (Table11). Table 12 shows that all items appeared to be worthy of retention, resulting in a decrease in the alpha if deleted.
From construct and validity test it was found that the there is no common bias in the collected data and the reliability test presented high score of Cronbach's Alpha which indicated high degree of reliability.
11. b) Univariate statistics
Data were collected and organized, the univariate test is simple test conducted in order to explore the data and measure the frequencies of attributes as well as mean, median and mode. Univariate test utilized for description purposes; it doesn't involve finding relationships between data.
In this research paper, questionnaire consists of 39 questions, univariate statistical test carried out for exploring frequencies and description purposes. Appendix B consists of the Univariate Statistics for construct's attributes as well as Univariate Statistics for Demographics. Tables below consists of comparison between frequencies of construct's attributes:
12. i. Comparison of the percent of each of the specification of self-driving car that user interested in:
When comparing the self-driving car's specifications; statistics presented that respondents highly care about safety specifications. Statistics as well represented the following as seen in Table 13 and Figure 3 below: 1. Around 95% of respondents care about comfort specifications.
2. More than 97% of respondents with different degree of agreement care about safety, luxury, braking system, car's outside look, speed, number of passengers, wheels and seating's specifications, engine specifications of self-driving car. 3. Around 92% of respondents care about entertainment specifications. 4. Partial-autonomous cars are much preferred than complete autonomous cars. From all above, it is clear that people highly care about all the specifications of the self-driving car. Respondents highly care about safety of selfdriving car. Statistics represented the following as seen in Table 14 and Figure 4 below: 1. More than84% of respondents believe that selfdriving car is safe. 2. More than 87% of respondents believe that selfdriving car will never exceed speed limit.
3. More than 79% of respondents believe that selfdriving car will never break road rules. 4. More than 69% of respondents believe that selfdriving car will reduce car accidents while around 13% disagree that self-driving car will reduce car accidents. 5. More than 87% of respondents believe that selfdriving car safety features have great impact that will encourage people to buy such car. From all above, people highly believe that self-driving car would be a safe car, and safety features would encourage people to buy such car. 1. More than 74% of respondents believe that selfdriving car would efficiently reach destination fast, on the other side, around 15% disagree about this. 2. 80% of respondents believe that self-driving car will not consume much fuel. 3. More than 87% of respondents believe that the performance features of self-driving car will encourage them to buy it.
From all above, people highly believe that self-driving car would have great performance, and performance features would encourage people to buy such car. Comparison of the percent of each of the user's expectations of self-driving car ease of use features:
Respondents have high expectations about Ease of Use features of self-driving car. Statistics represented the following as seen in Table 16 and Figure 6 below:
1. Around 90% of respondents believe that self-driving car would be easy to use.
2. Around 95% of respondents believe that they will learn how to use self-driving car fast. 3. More than 92% of respondents believe that the Ease of Use features of self-driving car will encourage them to buy it.
From all above, people highly believe that selfdriving car would be easy to use, and they will learn fast how to use it, people as well believe that Ease of Use features would encourage them to buy such car. 1. More than 92% of respondents believe that selfdriving car would provide comfort to them. 2. More than 74% of respondents believe that selfdriving car would be reliable car and it would reduce traffic jam.
3. More than 87% of respondents believe that selfdriving car will reduce the pressure due to driving. 4. More than 87% of respondents believe that the benefits of self-driving car will encourage them to buy it.
From all above, people highly believe that selfdriving car would provide benefits to them and these usefulness features would encourage them to buy such car. Respondents have high intention to turn into using self-driving car. Statistics represented the following as seen in Table 18 and Figure 8 below: 1. More than 71% of respondents are willing to pay even more for the self-driving car while around 13% disagree about this.
2. 77% of respondents would recommend using selfdriving car. 3. More than 87% think that owning self-driving car is a good idea even that only 77% of respondents have the intention to buy self-driving car in the future while around 10% haven't the intention to buy such car in the future.
From all above, people in UAE have great intention to turn into using self-driving car in the future. From all above, it is clear that UAE people highly care about all the specifications of the self-driving car, Thus Hypothesis H1 is accepted. The results show that there is an intermediate positive relationship between the constructs (Global Variables) along with intermediate correlation. So, the above suggested Hypotheses H2 is accepted.
13. Regression Test:
Regression test conducted to whether the specifications of self-driving car could predict the UAE people's intention to turn into using self-driving car. Intermediate positive correlation exists between the selfdriving car's specifications and the people's intention to turn into using self-driving car (R= .383) and the regression model predicted 14% of the variance. In other words, UAE people's intention to turn into using self-driving car is intermediately predicted by self-driving car's specifications as seen in Table 21 below. 23 below shows that the for the independent variable (SPC), the probability for the t statistic (2.525) for b coefficient is .016 which is less than the level of significance (.05). So, there is a statistically significant relationship between the specifications of the self-driving car and the intention to use that car. Therefore, H2 is accepted. Also, b coefficient that associated with SPC (.383) is positive and implies that the better the specifications of the selfdriving car the higher intention of the user to turn into using self-driving car. Q3: Does the self-driving car's features impact the UAE people's intention to turn into using self-driving car? H3: There is significant association between self-driving car's features and the UAE people's intention to turn into using self-driving car. H4: There is significant association between self-driving car's safety features and the UAE people's intention to turn into using self-driving car.
H5: There is significant association between self-driving car's performance features and the UAE people's intention to turn into using self-driving car. H6: There is significant association between self-driving car's Ease of Use features and the UAE people's intention to turn into using self-driving car. H7: There is significant association between self-driving car's Usefulness features and the UAE people's intention to turn into using self-driving car. For this research question, global variables identified as following: A Bivariate correlation test was conducted as seen in the table24. Correlation test was carried out to check if there is association between Intention to turn into using self-driving car (INT) and features (FET), safety features (SFET), performance features (PFET), ease of use features (EFET) and usefulness (BFET) of self-driving car at (0.01) level, findings are: The results show that there is a strong positive relationship between all of the constructs (Global Variables) along with strong correlation. So, the above suggested Hypotheses are all accepted, and all the null Hypotheses were rejected. Regression Test:
?Regression test conducted to whether the features of self-driving car could predict the UAE people's intention to turn into using self-driving car. Strong positive correlation exists between the selfdriving car's features and the people's intention to turn into using self-driving car (R= .875) and the regression model predicted 76% of the variance. In other words, UAE people's intention to turn into using self-driving car is strongly predicted by self-driving car's features as seen in Table 25 below. 27 below shows that the for the independent variable (FET), the probability for the t statistic (10.054) for b coefficient is .000 which is less than the level of significance (.05). So, there is a statistically significant relationship between the perceived features of the self-driving car and the intention to use that car. Therefore, H3 is accepted. Also, b coefficient that associated with FET (.856) is positive and implies that the much excellent features of the self-driving car the higher intention of the user to turn into using self-driving car. 28below shows that the for the independent variable (SFET), the probability for the t statistic (6.717) for b coefficient is .000 which is less than the level of significance (.05). So, there is a statistically significant relationship between the perceived features of the self-driving car and the intention to use that car. Therefore, H4 is accepted. Also, b coefficient that associated with FET (.741) is positive and implies that the much excellent Safety features of the self-driving car the higher intention of the user to turn into using self-driving car. 29 below shows that the for the independent variable (PFET), the probability for the t statistic (5.733) for b coefficient is .000 which is less than the level of significance (.05). So, there is a statistically significant relationship between the perceived features of the self-driving car and the intention to use that car. Therefore, H5 is accepted. Also, b coefficient that associated with FET (.686) is positive and implies that the much excellent Performance features of the self-driving car the higher intention of the user to turn into using self-driving car. 30below shows that the for the independent variable (EFET), the probability for the t statistic (7.765) for b coefficient is .000 which is less than the level of significance (.05). So, there is a statistically significant relationship between the perceived features of the self-driving car and the intention to use that car. Therefore, H6 is accepted. Also, b coefficient that associated with FET (.787) is positive and implies that the much excellent Ease of Use features of the self-driving car the higher intention of the user to turn into using self-driving car. 31 below shows that the for the independent variable (BFET), the probability for the t statistic (7.386) for b coefficient is .000 which is less than the level of significance (.05). So, there is a statistically significant relationship between the perceived features of the self-driving car and the intention to use that car. Therefore, H7 is accepted. Also, b coefficient that associated with FET (.772) is positive and implies that the much excellent Usefulness features of the self-driving car the higher intention of the user to turn into using self-driving car. Results presented that UAE people have high intention to turn into using self-driving car. Statistics represented the following as seen in Table 32 and Figure 10 below: 1. More than 71% of respondents are willing to pay even more for the self-driving car while around 13% disagree about this. 2. 77% of respondents would recommend using selfdriving car. 3. More than 87% think that owning self-driving car is a good idea even that only 77% of respondents have the intention to buy self-driving car in the future while around 10% haven't the intention to buy such car in the future.
( )
14. H
Year 2020
From all above, people in UAE have great intention to turn into using self-driving car in the future. Thus, Hypothesis H8 is accepted. Q5: Does the Gender factor have different impact on the intention to turn into using self-driving car? H9: there is no significant difference between males and females in their intention to turn into using self-driving car.
T-Test conducted to compare the intention to turn into using self-driving car based on the gender. An independent samples test was carried out to compare the intention to turn into using self-driving car based on gender. As seen in table 33 and table 34 There is no significant difference in the intention between Male and Female, t(39)= -0.533, p>0.05, two tailed with Female (M=34.1579, SD=7.80501) have slight higher intention to turn into using self-driving car than Male (M=32.9500, SD=6.30351). the magnitude of the difference in the means (mean difference 34.1579-32.9500=1.2079, 95% CI: -5.79966 to 3.38387) was small (eta squared = 0.0076). Since there is no significant difference in the intention between Male and Female to turn into using self-driving car, therefore, H9 is accepted. P3V4 ease-of-use P3V5 willing-buy P3V6 own-idea H10: Driving Experience have positive impact on the intention to turn into using self-driving car. From table 36 below, it is clear that there are no statistically differences between the groups as a whole since the sig > 0.05. One-way between groups analysis of variance was conducted to explore the impact of Driving Experience on the intention to turn into self-driving car. Participant were divided into six groups as the following (Never, Less than 5, 5-9, 10-14, 15-20, More than 20). We can see that the significance values 0.998, 0.913, 0.999, 0.994, 0.983, 0.991, 0.867, 0.971, 0.850, 0.645, 0.995, 0.883, 0.997 and 1.000 (i.e., p= values 0.998, 0.913, 0.999, 0.994, 0.983, 0.991, 0.867, 0.971, 0.850, 0.645, 0.995, 0.883, 0.997 and 1.000) which is above 0.05 as seen in table 37 below. Therefore, there is no statistically significant difference in the rating of intention to turn into using self-driving car based on the Driving Experience of the respondents. Thus, hypothesis H10 is rejected. viii. Chi-squared test to investigate whether there is association between gender and Driving Experience: H12: there is significant association between gender and driving experience.
15. Intention to turn into using self-driving car attributes
The sample size is less than 40, i.e. 39 so the smallest expected frequency is at least 5. Chi-Square test can be used to compare if there is an observed frequency distribution with an expected frequency distribution. Chi-Square test will be used to compare if there is observed frequency between driving experience and gender within the population.
Table 39 displays how gender is associated with driving experience. (2-sided) value in this row, 0.010, is the p value rounded to 5 decimal places and should not be quoted in this form. Since p is less than 0.05 then there is an evidence of strong relationship between the gender and driving experience. This indicates that there is statistically significant association between Gender and Driving Experience.
16. Findings
Statistical Analysis conducted in previous section in order to answer research questions as well as examining hypothesis, table below present whether the hypothesis accepted or rejected: Q2: Does the specifications of the self-driving car impact the UAE people's intention to turn into using self-driving car?
H2: There is significant association between self-driving car's specifications and the UAE people's intention to turn into using self-driving car.(Accepted)
Q3: Does the self-driving car's features impact the UAE people's intention to turn into using self-driving car?
H3: There is significant association between self-driving car's features and the UAE people's intention to turn into using self-driving car.(Accepted) H4: There is significant association between self-driving car's safety features and the UAE people's intention to turn into using self-driving car. (Accepted) H5: There is significant association between self-driving car's performance features and the UAE people's intention to turn into using self-driving car.(Accepted) H6: There is significant association between self-driving car's Ease of Use features and the UAE people's intention to turn into using self-driving car.(Accepted) H7: There is significant association between self-driving car's Usefulness features and the UAE people's intention to turn into using self-driving car. Statistical Analysis conducted as well for construct and scale validity; it was found that the there is no common bias in the collected data and the reliability test presented high score of Cronbach's Alpha which indicated high degree of reliability.
Univariate statistical test carried out for exploring frequencies and description purposes and results reported in previous section.
17. VIII.
18. Discussion
In this research paper, Technology Acceptance Model modified by the author of this research paper to include additional constructs. The aim of this research paper to investigate the validity of the modified model in case for the acceptance of self-driving car in United Arab Emirates as the research main purpose is to investigate the intention of UAE people to turn into using self-driving car.
Statistical tests for answering first research question presented that UAE people highly care about the specifications of self-driving car. Responses showed that each of the specifications is important, but the most important specifications are safety, luxury, system, wheels and car's outside look. This result indicated that people are in UAE become more aware about their rights as customers to know about the product's specifications. People as well become more knowledgeable about the importance of each of the specifications of the self-driving car.
Results from statistical tests for answering second research question presented that self-driving car's specification is associated with the intention to turn into using self-driving car.
Results from statistical tests for answering third research question presented that self-driving car's features have strong positive impact on the UAE people's intention to turn into using self-driving car. This result is compatible with the Technology Acceptance Model that was introduced by Davis as stated by Paul Legrisa, John Inghamb, Pierre Collerettec, (2003). The Ease of Use features are strongly associated with the UAE people's intention to turn into using self-driving car. Results presented as well that the Usefulness features are strongly associated with the UAE people's intention to turn into using self-driving car. These results are consistent with the Technology acceptance Model. Author of this research paper investigated Safety features and performance features effects, and results presented that both of the defined features strongly associated with the intention to turn into using selfdriving car. Hence, self-driving car's features are strongly associated with the intention to turn into using self-driving car.The features of self-driving car have stronger impact on the intention to turn into using selfdriving car than the specification does.
Fourth research question results presented that people in United Arab Emirates have high intention to turn into using self-driving car as results showed that people are willing to pay even more for the self-driving car, they would recommend using self-driving car for others and they think that owning such car is a good idea. This Result is consistent and compatible with the Technology Acceptance Model as the features of selfdriving car positively impacted the people's intention to use the car.
Statistical tests conducted to answer fifth research question and results showed that there is no significant difference in the intention between Male and Female to turn into using self-driving car. Therefore, the gender factor has no impact on the intention to turn into using self-driving car. Statistical tests for answering sixth research question presented that Driving Experience as well has no impact on the intention to turn into usingself-driving car.
Seventh research question results showed that the Education Level slightly impact the people's intention to turn into using-self-driving car. Hence from all above statistical experiments conducted, the features as well as specifications of self-driving car is strongly associated with the intention to turn into using the car, hence the features and specifications of self-driving car impacted UAE people's intention to accept and turn into using such car and this result consistent and compatible with the Technology Acceptance Mode. Below is the updated conceptual research model.
19. Conclusion
The emergence of self-driving cars has raised the interest of the media as well as individuals in it and how reliable and what benefits the user may get when using this type of car. Although the self-driving car may provide huge benefits to the user compared to the traditional car that the user drive, the people perception to turn into using this type of car may vary as some users prefer to engage in driving by themselves. This research paper aim to explore UAE people's intention to turn into using self-driving car. To explore the research aim, based upon standard Technology Acceptance Model (TAM), author of this research paper adjusted TAM by adding new constructs. Quantitative methodology followed in this research paper and questionnaire was prepared and sent to respondents i.e. people live in UAE. Results presented that UAE people have high intention to turn into using self-driving car. Results presented as well that both specifications and features of self-driving car have great impact on people's intention to use the car and this result consistent with TAM. It is recommended for future research to investigate the infrastructure requirements for the adoption of self-driving car, and the impacts of the adoption of self-driving car as well. Intention to turn into using self-driving (INT) I am willing to pay more for self-driving car P3V1 willing-pay I believe self-driving car has a lot of benefits P3V2 lot-benefits I would recommend trying self-driving car P3V3 recommend-use I believe that self-driving car is easy to use P3V4 ease-of-use I would buy self-driving car in future P3V5 willing-buy Owning self-driving car is a great idea P3V6 own-idea The responses showed that people with bachelor's degree are the most respondents (64.1%) as shown in figure 17 and table 46.
| Research Question | Related Hypothesis |
| Q1: To what extent UAE people care about specifications | |
| of the self-driving car? |
| Demographic Questions | Related Hypothesis |
| Q5: Does the Gender factor have different impact on the | |
| intention to turn into using self-driving car? |
| Year 2020 | |||||||||
| ( ) H | |||||||||
| Component | Total | Initial Eigen values % of Variance Cumulative % | Extraction Sums of Squared Loadings Total % of Variance Cumulative % | Rotation Sums of Squared Loadings % of Cumulative Total Variance % | |||||
| 1 | 15.719 | 40.306 | 40.306 | 15.719 | 40.306 | 40.306 | 10.354 | 26.550 | 26.550 |
| 2 | 4.275 | 10.961 | 51.267 | 4.275 | 10.961 | 51.267 | 3.643 | 9.340 | 35.889 |
| 3 | 2.649 | 6.793 | 58.059 | 2.649 | 6.793 | 58.059 | 3.572 | 9.159 | 45.049 |
| 4 | 2.165 | 5.550 | 63.610 | 2.165 | 5.550 | 63.610 | 3.181 | 8.156 | 53.205 |
| 5 | 1.851 | 4.745 | 68.355 | 1.851 | 4.745 | 68.355 | 2.856 | 7.324 | 60.528 |
| 6 | 1.705 | 4.371 | 72.726 | 1.705 | 4.371 | 72.726 | 2.747 | 7.043 | 67.572 |
| 7 | 1.274 | 3.267 | 75.993 | 1.274 | 3.267 | 75.993 | 2.318 | 5.943 | 73.515 |
| 8 | 1.260 | 3.230 | 79.223 | 1.260 | 3.230 | 79.223 | 1.774 | 4.548 | 78.062 |
| 9 | 1.019 | 2.612 | 81.835 | 1.019 | 2.612 | 81.835 | 1.471 | 3.773 | 81.835 |
| 10 | .919 | 2.356 | 84.192 | ||||||
| 11 | .760 | 1.948 | 86.139 | ||||||
| 12 | .744 | 1.907 | 88.046 | ||||||
| 13 | .662 | 1.697 | 89.744 | ||||||
| 14 | .656 | 1.681 | 91.425 | ||||||
| Year 2020 | |||
| ( ) H | |||
| Reliability for self-driving car's specification | |||
| construct's variables: | |||
| Item Statistics | |||
| Mean | Std. Deviation | N | |
| P1V1comfort | 6.436 | .8521 | 39 |
| P1V2safetysystem | 6.795 | .9782 | 39 |
| P1V3luxury | 6.462 | .6426 | 39 |
| P1V4wheels | 6.615 | .9066 | 39 |
| P1V5brakingsystem | 6.846 | .3655 | 39 |
| P1V6look | 6.436 | .9678 | 39 |
| P1V7passengers | 6.282 | .9719 | 39 |
| P1V8seating | 6.564 | .7538 | 39 |
| P1V9entertainment | 6.282 | .9162 | 39 |
| P1V10multi-view | 6.205 | .9509 | 39 |
| P1V11engine | 6.462 | .8840 | 39 |
| Reliability Statistics | ||
| Cronbach's Alpha | Cronbach's Alpha Based on Standardized Items | N of Items |
| .771 | .773 | 14 |
| Item-Total Statistics | |||||
| Scale Mean if Item Deleted | Scale Variance if Item Deleted | Corrected Item-Total Correlation | Squared Multiple Correlation | Cronbach's Alpha if Item Deleted | |
| P1V1comfort | 82.872 | 40.167 | -.072 | .264 | .796 |
| P1V2safetysystem | 82.513 | 37.099 | .173 | .534 | .779 |
| P1V3luxury | 82.846 | 36.239 | .447 | .578 | .755 |
| P1V4wheels | 82.692 | 34.640 | .436 | .696 | .753 |
| P1V5brakingsystem | 82.462 | 38.939 | .228 | .409 | .770 |
| P1V6look | 82.872 | 32.904 | .565 | .712 | .739 |
| P1V7passengers | 83.026 | 32.710 | .581 | .741 | .737 |
| P1V8seating | 82.744 | 34.038 | .626 | .841 | .739 |
| P1V9entertainment | 83.026 | 34.289 | .465 | .737 | .750 |
| P1V10multi-view | 83.103 | 32.831 | .585 | .728 | .737 |
| P1V11engine | 82.846 | 35.502 | .364 | .777 | .760 |
| P1V12speed | 83.051 | 35.260 | .390 | .386 | .757 |
| P1V13complete-autonomous | 83.872 | 31.220 | .447 | .521 | .755 |
| P1V14partial-autonomous | 83.077 | 36.915 | .258 | .438 | .768 |
| Year 2020 | |||
| ( ) H | |||
| Item Statistics | |||
| Mean | Std. Deviation | N | |
| P2V1safe | 5.513 | 1.2539 | 39 |
| P2V2speed-limit | 5.641 | 1.1353 | 39 |
| P2V3road-rules | 5.564 | 1.3138 | 39 |
| P2V4reduce-accidents | 5.205 | 1.4360 | 39 |
| P2V5safety-encourage | 5.718 | 1.1227 | 39 |
| P2V6reach-destination | 5.231 | 1.5638 | 39 |
| P2V7fuel | 5.436 | 1.3533 | 39 |
| P2V8performane-encourage | 5.615 | 1.1611 | 39 |
| P2V9easy-to-use | 5.564 | 1.3138 | 39 |
| P2V10easy-to-learn | 5.897 | 1.0953 | 39 |
| P2V11easy-encourage | 5.821 | .8545 | 39 |
| P2V12efficient-destination | 5.513 | 1.2952 | 39 |
| P2V13 benefit-comfort | 5.974 | 1.0127 | 39 |
| P2V14 reliable | 5.179 | 1.4303 | 39 |
| P2V15 benefit-safe | 5.333 | 1.3045 | 39 |
| Reliability Statistics | |||
| Cronbach's Alpha | Cronbach's Alpha Based on Standardized Items | N of Items | |
| .957 | .958 | 19 | |
| A reliability analysis was carried out. The scale | degree of reliability for the second construct i.e. self- | ||
| covering 19 items i.e. construct's variables. Cronbach's | driving car's features, ?= 0.957 (Table8). | ||
| alpha in Table 8 showed the questionnaire to reach high | |||
| Item-Total Statistics | |||||
| Scale Mean if | Scale Variance | Corrected Item- | Squared Multiple | Cronbach's Alpha | |
| Item Deleted | if Item Deleted | Total Correlation | Correlation | if Item Deleted | |
| P2V1safe | 100.846 | 289.291 | .728 | .844 | .954 |
| P2V2speed-limit | 100.718 | 290.366 | .782 | .750 | .954 |
| P2V3road-rules | 100.795 | 288.536 | .709 | .789 | .955 |
| P2V4reduce-accidents | 101.154 | 282.660 | .770 | .883 | .954 |
| P2V5safety-encourage | 100.641 | 293.078 | .718 | .909 | .955 |
| P2V6reach-destination | 101.128 | 279.536 | .764 | .808 | .954 |
| P2V7fuel | 100.923 | 289.178 | .672 | .872 | .955 |
| P2V8performane-encourage | 100.744 | 289.143 | .796 | .857 | .953 |
| P2V9easy-to-use | 100.795 | 282.588 | .851 | .892 | .952 |
| P2V10easy-to-learn | 100.462 | 299.045 | .572 | .897 | .956 |
| P2V11easy-encourage | 100.538 | 300.150 | .711 | .826 | .955 |
| P2V12efficient-destination | 100.846 | 288.239 | .728 | .764 | .954 |
| P2V13 benefit-comfort | 100.385 | 295.874 | .718 | .872 | .955 |
| P2V14 reliable | 101.179 | 282.625 | .775 | .807 | .954 |
| P2V15 benefit-safe | 101.026 | 284.078 | .822 | .936 | .953 |
| P2V16 reduce-traffic | 101.026 | 292.920 | .646 | .704 | .956 |
| P2V17road-time | 100.359 | 293.131 | .699 | .837 | .955 |
| P2V18 reduce-pleasure | 100.333 | 290.965 | .719 | .808 | .955 |
| P2V19 benefit-encourage | 100.564 | 291.358 | .565 | .674 | .957 |
| Year 2020 | |||
| ( ) H | |||
| Item Statistics | |||
| Mean | Std. Deviation | N | |
| P3V1 willing-pay | 5.103 | 1.4653 | 39 |
| P3V2 lot-benefits | 5.872 | .9509 | 39 |
| P3V3 recommend-use | 5.692 | 1.3984 | 39 |
| P3V4 ease-of-use | 5.692 | 1.2387 | 39 |
| P3V5 willing-buy | 5.410 | 1.4818 | 39 |
| P3V6 own-idea | 5.769 | 1.3468 | 39 |
| Reliability Statistics | ||
| Cronbach's Alpha | Cronbach's Alpha Based on Standardized Items | N of Items |
| .942 | .946 | 6 |
| Item-Total Statistics | |||||
| Scale Mean if Item Deleted | Scale Variance if Item Deleted | Corrected Item-Total Correlation | Squared Multiple Correlation | Cronbach's Alpha if Item Deleted | |
| P3V1 willing-pay | 28.436 | 33.779 | .773 | .620 | .939 |
| P3V2 lot-benefits | 27.667 | 38.754 | .797 | .703 | .939 |
| P3V3 recommend-use | 27.846 | 33.028 | .878 | .809 | .925 |
| P3V4 ease-of-use | 27.846 | 35.818 | .792 | .701 | .935 |
| P3V5 willing-buy | 28.128 | 32.062 | .884 | .865 | .924 |
| P3V6 own-idea | 27.769 | 33.498 | .884 | .850 | .924 |
| P1V1comfort | P1V2safetysystem | P1V3luxury | P1V4wheels | P1V5brakingsystem | P1V6look | P1V7passengers | P1V8seating | P1V9entertainment | P1V10multi-view | P1V11engine | P1V12speed | P1V13complete- | autonomous | P1V14partial- | autonomous | |
| Strongly Disagree | 0 | 2.6 | 0 | 0 | 0 | 0 | 0 | 0 | 0 | 0 | 0 | 0 | 0 | 0 | ||
| Disagree | 0 | 0 | 0 | 2.6 | 0 | 2.6 | 2.6 | 0 | 0 | 0 | 0 | 0 | 5.1 | 0 | ||
| Slightly Disagree | 2.6 | 0 | 0 | 0 | 0 | 0 | 0 | 0 | 0 | 2.6 | 2.6 | 2.6 | 5.1 | 0 | ||
| Neutral | 2.6 | 0 | 0 | 0 | 0 | 0 | 0 | 2.6 | 7.7 | 2.6 | 0 | 0 | 10.3 | 2.6 | ||
| Slightly Agree | 0 | 0 | 7.7 | 2.6 | 0 | 7.7 | 10.3 | 7.7 | 7.7 | 12.8 10.3 12.8 25.6 | 15.4 | |||||
| Agree | 38.5 | 5.1 | 38.5 20.5 15.4 28.2 38.5 20.5 33.3 35.9 23.1 38.5 28.2 | 38.5 | ||||||||||||
| Agree Strongly | 56.4 92.3 53.8 74.4 84.6 61.5 48.7 69.2 51.3 46.2 64.1 46.2 25.6 | 43.6 | ||||||||||||||
| P2V1safe | P2V2speed- | limit | P2V3road-rules | P2V4reduce- | accidents | P2V5safety- | encourage | |
| Strongly Disagree | 2.6 | 0 | 0 | 2.6 | 0 | |||
| Disagree | 0 | 2.6 | 2.6 | 0 | 2.6 | |||
| Slightly Disagree | 2.6 | 2.6 | 5.1 | 10.3 | 0 | |||
| Neutral | 10.3 | 7.7 | 12.8 | 17.9 | 10.3 | |||
| Slightly Agree | 28.2 | 23.1 | 20.5 | 17.9 | 23.1 | |||
| Agree | 35.9 | 43.6 | 30.8 | 33.3 | 38.5 | |||
| Agree Strongly | 20.5 | 20.5 | 28.2 | 17.9 | 25.6 | |||
| P2V6reach-destination | P2V7fuel | P2V8performane-encourage | |
| Strongly Disagree | 2.6 | 0 | 0 |
| Disagree | 5.1 | 2.6 | 2.6 |
| Slightly Disagree | 7.7 | 10.3 | 2.6 |
| Neutral | 10.3 | 5.1 | 7.7 |
| Slightly Agree | 20.5 | 30.8 | 28.2 |
| Agree | 33.3 | 25.6 | 35.9 |
| Agree Strongly | 20.5 | 25.6 | 23.1 |
| P2V9easy-to-use | P2V10easy-to-learn | P2V11easy-encourage | |
| Strongly Disagree | 0 | 0 | 0 |
| Disagree | 7.7 | 2.6 | 0 |
| Slightly Disagree | 0 | 2.6 | 0 |
| Neutral | 2.6 | 0 | 7.7 |
| Slightly Agree | 30.8 | 23.1 | 23.1 |
| Agree | 35.9 | 41 | 48.7 |
| Agree Strongly | 23.1 | 30.8 | 20.5 |
| user's | ||||||||
| 60 | ||||||||
| 50 | ||||||||
| 40 | ||||||||
| 30 | ||||||||
| 20 | ||||||||
| 10 | ||||||||
| 0 | ||||||||
| P2V9easy-to-use | P2V10easy-to-learn | P2V11easy-encourage | ||||||
| P2V12efficient-destination | P2V13 benefit-comfort | P2V14 reliable | P2V15 benefit-safe | P2V16 reduce-traffic | P2V17road-time | P2V18 reduce-pressure | P2V19 benefit-encourage | |
| Strongly Disagree | 2.6 | 0 | 0 | 2.6 | 0 | 0 | 0 | 2.6 |
| Disagree | 0 | 0 | 7.7 | 2.6 | 0 | 0 | 2.6 | 2.6 |
| Slightly Disagree | 2.6 | 2.6 | 5.1 | 0 | 7.7 | 5.1 | 0 | 5.1 |
| Neutral | 12.8 | 5.1 | 12.8 | 15.4 | 17.9 | 5.1 | 10.3 | 2.6 |
| Slightly Agree | 25.6 | 20.5 | 28.2 | 28.2 | 30.8 | 17.9 | 12.8 | 15.4 |
| Agree | 33.3 | 35.9 | 28.2 | 35.9 | 20.5 | 28.2 | 28.2 | 33.3 |
| Agree Strongly | 23.1 | 35.9 | 17.9 | 15.4 | 23.1 | 43.6 | 46.2 | 38.5 |
| P3V1 willing-pay | P3V2 lot-benefits | P3V3 recommend- | use | P3V4 ease-of-use | P3V5 willing-buy | P3V6 own-idea | |
| Strongly Disagree | 2.6 | 0 | 2.6 | 0 | 0 | 2.6 | |
| Disagree | 2.6 | 0 | 0 | 2.6 | 7.7 | 0 | |
| Slightly Disagree | 10.3 | 0 | 0 | 2.6 | 2.6 | 2.6 | |
| Neutral | 12.8 | 10.3 | 20.5 | 10.3 | 12.8 | 7.7 | |
| Slightly Agree | 25.6 | 20.5 | 15.4 | 23.1 | 23.1 | 25.6 | |
| Agree | 30.8 | 41 | 23.1 | 30.8 | 25.6 | 23.1 | |
| Agree Strongly | 15.4 | 28.2 | 38.5 | 30.8 | 28.2 | 38.5 | |
| Year 2020 | |||
| Figure 8: Intention to turn into using self-driving car frequencies | |||
| c) Results of Research Questions and Hypothesis | 1. Around 95% of respondents care about comfort | ||
| Testing | specifications. | ||
| In order to investigate the answer for the | 2. More than 97% of respondents with different degree | ||
| research questions and testing the defined hypothesis | of agreement care about safety, luxury, braking | ||
| for the research, number of statistical tests are | system, car's outside look, speed, number of | ||
| Strongly Disagree conducted as presented below: Disagree | Slightly Disagree | Neutral passengers, wheels and seating's specifications, Slightly Agree Agree Agree Strongly | |
| self-driving car. i. Frequency test to measure UAE people interest about self-driving car's specifications: Q1: To what extent UAE people care about specifications of the self-driving car? H1: UAE people highly care about the specification of | engine specifications of self-driving car. 3. Around 92% of respondents care about entertainment specifications. 4. Partial-autonomous cars are much preferred than complete autonomous cars. | ( ) H | |
| When comparing the self-driving car's | |||
| specifications; statistics presented that respondents | |||
| highly care about self-driving car's specifications. | |||
| Statistics as well represented the following as seen in | |||
| Table 19 and Figure 9 below: | |||
| P1V1comfort | P1V2safetysystem | P1V3luxury | P1V4wheels | P1V5brakingsystem | P1V6look | P1V7passengers | P1V8seating | P1V9entertainment | P1V10multi-view | P1V11engine | P1V12speed | P1V13complete- | autonomous | P1V14partial- | autonomous | |
| Strongly Disagree | 0 | 2.6 | 0 | 0 | 0 | 0 | 0 | 0 | 0 | 0 | 0 | 0 | 0 | 0 | ||
| Disagree | 0 | 0 | 0 | 2.6 | 0 | 2.6 | 2.6 | 0 | 0 | 0 | 0 | 0 | 5.1 | 0 | ||
| Slightly Disagree | 2.6 | 0 | 0 | 0 | 0 | 0 | 0 | 0 | 0 | 2.6 | 2.6 | 2.6 | 5.1 | 0 | ||
| Neutral | 2.6 | 0 | 0 | 0 | 0 | 0 | 0 | 2.6 | 7.7 | 2.6 | 0 | 0 | 10.3 | 2.6 | ||
| Slightly Agree | 0 | 0 | 7.7 | 2.6 | 0 | 7.7 10.3 7.7 | 7.7 12.8 10.3 12.8 25.6 15.4 | |||||||||
| Agree | 38.5 5.1 38.5 20.5 15.4 28.2 38.5 20.5 33.3 35.9 23.1 38.5 28.2 38.5 | |||||||||||||||
| Agree Strongly | 56.4 92.3 53.8 74.4 84.6 61.5 48.7 69.2 51.3 46.2 64.1 46.2 25.6 43.6 | |||||||||||||||
| Year 2020 | Strongly Disagree | Disagree | Slightly Disagree | Neutral | Slightly Agree | Agree | Agree Strongly |
| Figure 9: Specifications of self-driving car that UAE people car about | |||||||
| ( ) H | ii. Correlation test and Regression test to measure the relationship between self-driving car's | H2: There is significant association between self-driving car's specifications and the UAE people's intention to | |||||
| specification and people's intention to turn into | turn into using self-driving car. | ||||||
| using self-driving car: | For this research question, global variables | ||||||
| Q2: Does the specifications of the self-driving car | identified as following: | ||||||
| impact the UAE people's intention to turn into using self- | INT: intention into using self-driving car | ||||||
| driving car? | SPC: specification of self-driving car | ||||||
| Correlation Test: | |||||||
| Correlations | |||
| INT | SPC | ||
| Pearson Correlation | 1 | .383 * | |
| INT | Sig. (2-tailed) | .016 | |
| N | 39 | 39 | |
| Pearson Correlation | .383 * | 1 | |
| SPC | Sig. (2-tailed) | .016 | |
| N | 39 | 39 | |
| *. Correlation is significant at the 0.05 level (2-tailed). | |||
| A Bivariate correlation test was conducted as | |||
| seen in the table 20 above. Correlation test was carried | |||
| out to check if there is association between Intention to | |||
| turn into using self-driving car (INT) and specification | |||
| (SPC) of self-driving car at (0.05) level, findings are: | |||
| Model Summary b |
| ANOVA a | ||||||
| Model | Sum of Squares | df | Mean Square | F | Sig. | |
| Regression | 274.231 | 1 | 274.231 | 6.376 | .016 b | |
| 1 | Residual | 1591.462 | 37 | 43.012 | ||
| Total | 1865.692 | 38 | ||||
| a. Dependent Variable: INT | ||||||
| b. Predictors: (Constant), SPC | ||||||
| Also, Table | ||||||
| Coefficients a |
| Correlations | |||||||
| FET | SFET | PFET | EFET | BFET | INT | ||
| Pearson Correlation | 1 | .882 ** | .823 ** | .812 ** | .939 ** | .856 ** | |
| FET | Sig. (2-tailed) | .000 | .000 | .000 | .000 | .000 | |
| N | 39 | 39 | 39 | 39 | 39 | 39 | |
| Pearson Correlation | .882 ** | 1 | .676 ** | .638 ** | .760 ** | .741 ** | |
| SFET | Sig. (2-tailed) | .000 | .000 | .000 | .000 | .000 | |
| N | 39 | 39 | 39 | 39 | 39 | 39 | |
| Pearson Correlation | .823 ** | .676 ** | 1 | .556 ** | .711 ** | .686 ** | |
| PFET | Sig. (2-tailed) | .000 | .000 | .000 | .000 | .000 | |
| N | 39 | 39 | 39 | 39 | 39 | 39 | |
| Pearson Correlation | .812 ** | .638 ** | .556 ** | 1 | .760 ** | .787 ** | |
| EFET | Sig. (2-tailed) | .000 | .000 | .000 | .000 | .000 | |
| N | 39 | 39 | 39 | 39 | 39 | 39 | |
| Pearson Correlation | .939 ** | .760 ** | .711 ** | .760 ** | 1 | .772 ** | |
| BFET | Sig. (2-tailed) | .000 | .000 | .000 | .000 | .000 | |
| N | 39 | 39 | 39 | 39 | 39 | 39 | |
| Pearson Correlation | .856 ** | .741 ** | .686 ** | .787 ** | .772 ** | 1 | |
| INT | Sig. (2-tailed) | .000 | .000 | .000 | .000 | .000 | |
| N | 39 | 39 | 39 | 39 | 39 | 39 | |
| **. Correlation is significant at the 0.01 level (2-tailed). | |||||||
| Model Summary b |
| ANOVA a | ||||||
| Model | Sum of Squares | df | Mean Square | F | Sig. | |
| Regression | 1429.974 | 5 | 285.995 | 21.660 | .000 b | |
| 1 | Residual | 435.718 | 33 | 13.204 | ||
| Total | 1865.692 | 38 | ||||
| a. Dependent Variable: INT | ||||||
| b. Predictors: (Constant), BFET, PFET, EFET, SFET, FET | ||||||
| Also, Table | ||||||
| Coefficients a |
| Coefficients a |
| Coefficients a |
| Coefficients a |
| Coefficients a |
| P3V1 willing-pay | P3V2 lot-benefits | P3V3 recommend- | use | P3V4 ease-of-use | P3V5 willing-buy | P3V6 own-idea | |
| Strongly Disagree | 2.6 | 0 | 2.6 | 0 | 0 | 2.6 | |
| Disagree | 2.6 | 0 | 0 | 2.6 | 7.7 | 0 | |
| Slightly Disagree | 10.3 | 0 | 0 | 2.6 | 2.6 | 2.6 | |
| Neutral | 12.8 | 10.3 | 20.5 | 10.3 | 12.8 | 7.7 | |
| Slightly Agree | 25.6 | 20.5 | 15.4 | 23.1 | 23.1 | 25.6 | |
| Agree | 30.8 | 41 | 23.1 | 30.8 | 25.6 | 23.1 | |
| Agree Strongly | 15.4 | 28.2 | 38.5 | 30.8 | 28.2 | 38.5 | |
| Year 2020 | ||||||
| ( ) H | ||||||
| Strongly Disagree | Disagree | Slightly Disagree | Neutral | Slightly Agree | Agree | Agree Strongly |
| Independent Samples Test | ||||||||||
| Levene's Test for Equality of Variances | t-test for Equality of Means | |||||||||
| 95% Confidence | ||||||||||
| F | Sig. | t | df | Sig. (2-tailed) | Mean Difference | Std. Error Difference | Interval of the Difference | |||
| Lower | Upper | |||||||||
| INT | Equal variances assumed Equal variances not assumed | .094 | .761 | -.533 -.530 34.624 37 | .597 .599 | -1.20789 -1.20789 | 2.26620 2.27880 | -5.79966 3.38387 -5.83590 3.42011 | ||
| vi. Anova test to investigate whether the Driving | ||||||||||
| Experience factor have different impact on the | ||||||||||
| intention to use self-driving car: | ||||||||||
| Q6: Does the Driving Experience factor have different | ||||||||||
| impact on the intention to turn into using self-driving | ||||||||||
| car? | ||||||||||
| Descriptives | ||||||||
| INT | ||||||||
| N | Mean | Std. Deviation | Std. Error | 95% Confidence Interval for Mean Lower Bound Upper Bound | Minimum Maximum | |||
| Never | 4 | 33.2500 | 5.31507 | 2.65754 | 24.7925 | 41.7075 | 27.00 | 40.00 |
| Less than 5 years | 5 | 35.4000 | 5.54977 | 2.48193 | 28.5090 | 42.2910 | 28.00 | 42.00 |
| 5-9 | 2 | 39.5000 | 3.53553 | 2.50000 | 7.7345 | 71.2655 | 37.00 | 42.00 |
| 10-14 | 6 | 35.0000 | 9.01110 | 3.67877 | 25.5434 | 44.4566 | 20.00 | 42.00 |
| 15 -20 | 13 | 33.1538 | 8.47394 | 2.35025 | 28.0331 | 38.2746 | 14.00 | 42.00 |
| More than 20 years | 9 | 30.8889 | 5.13431 | 1.71144 | 26.9423 | 34.8355 | 21.00 | 36.00 |
| Total | 39 | 33.5385 | 7.00694 | 1.12201 | 31.2671 | 35.8098 | 14.00 | 42.00 |
| ANOVA | |||||
| INT | |||||
| Sum of Squares | df | Mean Square | F | Sig. | |
| Between Groups | 166.661 | 5 | 33.332 | .647 | .665 |
| Within Groups | 1699.031 | 33 | 51.486 | ||
| Total | 1865.692 | 38 |
| Multiple Comparisons | |||||||
| Dependent Variable: INT | |||||||
| Tukey HSD | |||||||
| (I) Driving Experience | (J) Driving Experience | Mean Difference (I-J) | Std. Error | Sig. | 95% Confidence Interval Lower Bound Upper Bound | ||
| Less than 5 years | -2.15000 | 4.81338 | .998 | -16.7034 | 12.4034 | ||
| 5-9 | -6.25000 | 6.21404 | .913 | -25.0384 | 12.5384 | ||
| Year 2020 | Never | 10-14 15 -20 More than 20 years | -1.75000 .09615 2.36111 | 4.63168 4.10267 4.31185 | .999 1.000 .994 | -15.7540 -12.3084 -10.6759 | 12.2540 12.5007 15.3981 |
| Never | 2.15000 | 4.81338 | .998 | -12.4034 | 16.7034 | ||
| 5-9 | -4.10000 | 6.00334 | .983 | -22.2513 | 14.0513 | ||
| Less than 5 years | 10-14 | .40000 | 4.34490 | 1.000 | -12.7369 | 13.5369 | |
| 15 -20 | 2.24615 | 3.77592 | .991 | -9.1705 | 13.6628 | ||
| More than 20 years | 4.51111 | 4.00222 | .867 | -7.5897 | 16.6120 | ||
| Never | 6.25000 | 6.21404 | .913 | -12.5384 | 25.0384 | ||
| Less than 5 years | 4.10000 | 6.00334 | .983 | -14.0513 | 22.2513 | ||
| 5-9 | 10-14 | 4.50000 | 5.85866 | .971 | -13.2138 | 22.2138 | |
| 15 -20 | 6.34615 | 5.45008 | .850 | -10.1323 | 22.8246 | ||
| More than 20 years | 8.61111 | 5.60924 | .645 | -8.3486 | 25.5708 | ||
| Never | 1.75000 | 4.63168 | .999 | -12.2540 | 15.7540 | ||
| ( ) H | 10-14 | Less than 5 years 5-9 | -.40000 -4.50000 | 4.34490 5.85866 | 1.000 .971 | -13.5369 -22.2138 | 12.7369 13.2138 |
| 15 -20 | 1.84615 | 3.54139 | .995 | -8.8613 | 12.5536 | ||
| More than 20 years | 4.11111 | 3.78175 | .883 | -7.3231 | 15.5453 | ||
| Never | -.09615 | 4.10267 | 1.000 | -12.5007 | 12.3084 | ||
| Less than 5 years | -2.24615 | 3.77592 | .991 | -13.6628 | 9.1705 | ||
| 15 -20 | 5-9 | -6.34615 | 5.45008 | .850 | -22.8246 | 10.1323 | |
| 10-14 | -1.84615 | 3.54139 | .995 | -12.5536 | 8.8613 | ||
| More than 20 years | 2.26496 | 3.11144 | .977 | -7.1426 | 11.6725 | ||
| Never | -2.36111 | 4.31185 | .994 | -15.3981 | 10.6759 | ||
| Less than 5 years | -4.51111 | 4.00222 | .867 | -16.6120 | 7.5897 | ||
| More than 20 years | 5-9 | -8.61111 | 5.60924 | .645 | -25.5708 | 8.3486 | |
| 10-14 | -4.11111 | 3.78175 | .883 | -15.5453 | 7.3231 | ||
| 15 -20 | -2.26496 | 3.11144 | .977 | -11.6725 | 7.1426 | ||
| vii. Correlation test to investigate there is association | ? The correlation between Education Level and | ||||||
| between Education Level and the intention to turn | intention to turn into using self-driving car (INT) is | ||||||
| into using self-driving car: | weak and positive = 0.175, i.e. 0 < r <0.25 and | ||||||
| Q7: Does the Education Level factor associated with the | positive. Therefore, hypothesis H11 is rejected. | ||||||
| intention to turn into using self-driving car? | |||||||
| H11: Level of Education is not associated with the | |||||||
| intention to turn into using self-driving car. | |||||||
| A Bivariate correlation test was conducted as | |||||||
| seen in the table 38below. Correlation test was carried | |||||||
| out to check if there is association between Intention to | |||||||
| turn into using self-driving car (INT) and the Education | |||||||
| level, test presented that: | |||||||
| Correlations | |||
| Education | INT | ||
| Pearson Correlation | 1 | .175 | |
| Education | Sig. (2-tailed) | .287 | |
| N | 39 | 39 | |
| Pearson Correlation | .175 | 1 | |
| INT | Sig. (2-tailed) | .287 | |
| N | 39 | 39 |
| Gender * Driving Experience Crosstabulation | ||||||||
| Driving Experience | ||||||||
| Never | Less than 5 years | 5-9 | 10-14 | 15 -20 | More than 20 years | Total | ||
| Count | 0 | 0 | 1 | 3 | 8 | 8 | 20 | |
| % within Gender | 0.0% | 0.0% | 5.0% | 15.0% | 40.0% | 40.0% | 100.0% | |
| Male | % within Driving Experience | 0.0% | 0.0% | 50.0% | 50.0% | 61.5% | 88.9% | 51.3% |
| Gender | % of Total Count | 0.0% 4 | 0.0% 5 | 2.6% 1 | 7.7% 3 | 20.5% 5 | 20.5% 1 | 51.3% 19 |
| % within Gender | 21.1% | 26.3% | 5.3% | 15.8% | 26.3% | 5.3% | 100.0% | |
| Female | % within Driving Experience | 100.0% | 100.0% | 50.0% | 50.0% | 38.5% | 11.1% | 48.7% |
| % of Total | 10.3% | 12.8% | 2.6% | 7.7% | 12.8% | 2.6% | 48.7% | |
| Count | 4 | 5 | 2 | 6 | 13 | 9 | 39 | |
| % within Gender | 10.3% | 12.8% | 5.1% | 15.4% | 33.3% | 23.1% | 100.0% | |
| Total | % within Driving Experience | 100.0% | 100.0% | 100.0% 100.0% 100.0% | 100.0% | 100.0% | ||
| % of Total | 10.3% | 12.8% | 5.1% | 15.4% | 33.3% | 23.1% | 100.0% | |
| When interpreting results from table 40 below, | ||||||||
| results of Pearson Chi-Square row shows that x(2)= | ||||||||
| 15.121, corresponding to p<0.05 (note: the Asymptotic | ||||||||
| Significance | ||||||||
| Year 2020 | ||||
| ( ) H | ||||
| Chi-Square Tests | ||||
| Value | df | Asymptotic Significance (2-sided) | ||
| Pearson Chi-Square | 15.121 a | 5 | .010 | |
| Likelihood Ratio | 19.347 | 5 | .002 | |
| Linear-by-Linear Association | 13.895 | 1 | .000 | |
| N of Valid Cases | 39 | |||
| a. 10 cells (83.3%) have expected count less than 5. The minimum expected count is .97. | ||||
| Phi and Cramer's are both tests of the strength | moderate and significant. P is less than 0.05 then | |||
| of association. From table 41 below, we can see that the | hypothesis H12 is accepted. | |||
| strength of the association between variables is | ||||
| Symmetric Measures | |||
| Value | Approximate Significance | ||
| Nominal by Nominal | Phi Cramer's V | .623 .623 | .010 .010 |
| N of Valid Cases | 39 | ||
| VII. | |||
| Research Question | Related Hypothesis |
| Q1: To what extent UAE people care about | H1: UAE people highly care about the specification of |
| specifications of the self-driving car? | self-driving car(Accepted) |
| Education | |||||
| Frequency | Percent | Valid Percent | Cumulative Percent | ||
| PHD | 2 | 5.1 | 5.1 | 5.1 | |
| Master | 9 | 23.1 | 23.1 | 28.2 | |
| Valid | Bachelor | 25 | 64.1 | 64.1 | 92.3 |
| Diploma | 1 | 2.6 | 2.6 | 94.9 | |
| Highschool | 2 | 5.1 | 5.1 | 100.0 | |
| Total | 39 | 100.0 | 100.0 |
| Driving Experience | |||||
| Frequency | Percent | Valid Percent | Cumulative Percent | ||
| Never | 4 | 10.3 | 10.3 | 10.3 | |
| Less than 5 years | 5 | 12.8 | 12.8 | 23.1 | |
| 5-9 | 2 | 5.1 | 5.1 | 28.2 | |
| Valid | 10-14 | 6 | 15.4 | 15.4 | 43.6 |
| 15 -20 | 13 | 33.3 | 33.3 | 76.9 | |
| More than 20 years | 9 | 23.1 | 23.1 | 100.0 | |
| Total | 39 | 100.0 | 100.0 | ||
| P1V1comfort | |||||
| Frequency | Percent | Valid Percent | Cumulative Percent | ||
| Slightly Disagree | 1 | 2.6 | 2.6 | 2.6 | |
| Neutral | 1 | 2.6 | 2.6 | 5.1 | |
| Valid | Agree | 15 | 38.5 | 38.5 | 43.6 |
| Agree Strongly | 22 | 56.4 | 56.4 | 100.0 | |
| Total | 39 | 100.0 | 100.0 | ||
| Table 50: Descriptive Statistics: frequencies | |||||
| P1V2safetysystem | |||||
| Frequency | Percent | Valid Percent | Cumulative Percent | ||
| Disagree Strongly | 1 | 2.6 | 2.6 | 2.6 | |
| Valid | Agree Agree Strongly | 2 36 | 5.1 92.3 | 5.1 92.3 | 7.7 100.0 |
| Total | 39 | 100.0 | 100.0 | ||
| P1V3luxury | |||||
| Frequency | Percent | Valid Percent | Cumulative Percent | ||
| Slightly Agree | 3 | 7.7 | 7.7 | 7.7 | |
| Valid | Agree Agree Strongly | 15 21 | 38.5 53.8 | 38.5 53.8 | 46.2 100.0 |
| Total | 39 | 100.0 | 100.0 | ||
| P1V4wheels | |||||
| Frequency | Percent | Valid Percent | Cumulative Percent | ||
| Disagree | 1 | 2.6 | 2.6 | 2.6 | |
| Slightly Agree | 1 | 2.6 | 2.6 | 5.1 | |
| Valid | Agree | 8 | 20.5 | 20.5 | 25.6 |
| Agree Strongly | 29 | 74.4 | 74.4 | 100.0 | |
| Total | 39 | 100.0 | 100.0 | ||
| P1V5brakingsystem | |||||
| Frequency | Percent | Valid Percent | Cumulative Percent | ||
| Agree | 6 | 15.4 | 15.4 | 15.4 | |
| Valid | Agree Strongly | 33 | 84.6 | 84.6 | 100.0 |
| Total | 39 | 100.0 | 100.0 | ||
| Table 54: Descriptive Statistics: frequencies | |||||
| P1V6look | |||||
| Frequency | Percent | Valid Percent | Cumulative Percent | ||
| Disagree | 1 | 2.6 | 2.6 | 2.6 | |
| Slightly Agree | 3 | 7.7 | 7.7 | 10.3 | |
| Valid | Agree | 11 | 28.2 | 28.2 | 38.5 |
| Agree Strongly | 24 | 61.5 | 61.5 | 100.0 | |
| Total | 39 | 100.0 | 100.0 | ||
| P1V7passengers | |||||
| Frequency | Percent | Valid Percent Cumulative Percent | |||
| Disagree | 1 | 2.6 | 2.6 | 2.6 | |
| Slightly Agree | 4 | 10.3 | 10.3 | 12.8 | |
| Valid | Agree | 15 | 38.5 | 38.5 | 51.3 |
| Agree Strongly | 19 | 48.7 | 48.7 | 100.0 | |
| Total | 39 | 100.0 | 100.0 | ||
| Table 56: Descriptive Statistics: frequencies | |||||
| P1V8seating | |||||
| Frequency | Percent | Valid Percent Cumulative Percent | |||
| Neutral | 1 | 2.6 | 2.6 | 2.6 | |
| Slightly Agree | 3 | 7.7 | 7.7 | 10.3 | |
| Valid | Agree | 8 | 20.5 | 20.5 | 30.8 |
| Agree Strongly | 27 | 69.2 | 69.2 | 100.0 | |
| Total | 39 | 100.0 | 100.0 | ||
| P1V9entertainment | |||||
| Frequency | Percent | Valid Percent Cumulative Percent | |||
| Neutral | 3 | 7.7 | 7.7 | 7.7 | |
| Slightly Agree | 3 | 7.7 | 7.7 | 15.4 | |
| Valid | Agree | 13 | 33.3 | 33.3 | 48.7 |
| Agree Strongly | 20 | 51.3 | 51.3 | 100.0 | |
| Total | 39 | 100.0 | 100.0 | ||
| P1V10multi-view | |||||
| Frequency | Percent | Valid Percent Cumulative Percent | |||
| Slightly Disagree | 1 | 2.6 | 2.6 | 2.6 | |
| Neutral | 1 | 2.6 | 2.6 | 5.1 | |
| Valid | Slightly Agree Agree | 5 14 | 12.8 35.9 | 12.8 35.9 | 17.9 53.8 |
| Agree Strongly | 18 | 46.2 | 46.2 | 100.0 | |
| Total | 39 | 100.0 | 100.0 | ||
| P1V11engine | |||||
| Frequency | Percent | Valid Percent Cumulative Percent | |||
| Slightly Disagree | 1 | 2.6 | 2.6 | 2.6 | |
| Slightly Agree | 4 | 10.3 | 10.3 | 12.8 | |
| Valid | Agree | 9 | 23.1 | 23.1 | 35.9 |
| Agree Strongly | 25 | 64.1 | 64.1 | 100.0 | |
| Total | 39 | 100.0 | 100.0 | ||
| Year 2020 | |||||
| ( ) H | |||||
| P1V12speed | |||||
| Frequency | Percent | Valid Percent | Cumulative Percent | ||
| Slightly Disagree | 1 | 2.6 | 2.6 | 2.6 | |
| Slightly Agree | 5 | 12.8 | 12.8 | 15.4 | |
| Valid | Agree | 15 | 38.5 | 38.5 | 53.8 |
| Agree Strongly | 18 | 46.2 | 46.2 | 100.0 | |
| Total | 39 | 100.0 | 100.0 | ||
| P1V13complete-autonomous | |||||
| Frequency | Percent | Valid Percent | Cumulative Percent | ||
| Disagree | 2 | 5.1 | 5.1 | 5.1 | |
| Sightly Disagree | 2 | 5.1 | 5.1 | 10.3 | |
| Neutral | 4 | 10.3 | 10.3 | 20.5 | |
| Valid | Slightly Agree | 10 | 25.6 | 25.6 | 46.2 |
| Agree | 11 | 28.2 | 28.2 | 74.4 | |
| Agree Strongly | 10 | 25.6 | 25.6 | 100.0 | |
| Total | 39 | 100.0 | 100.0 | ||
| Table 61: Descriptive Statistics: frequencies | |||||
| P1V14partial-autonomous | |||||
| Frequency | Percent | Valid Percent Cumulative Percent | |||
| Neutral | 1 | 2.6 | 2.6 | 2.6 | |
| Slightly Agree | 6 | 15.4 | 15.4 | 17.9 | |
| Valid | Agree | 15 | 38.5 | 38.5 | 56.4 |
| Agree Strongly | 17 | 43.6 | 43.6 | 100.0 | |
| Total | 39 | 100.0 | 100.0 | ||
| b. | |||||
| P2V1safe | |||||
| Frequency | Percent | Valid Percent | Cumulative Percent | ||
| Disagree Strongly | 1 | 2.6 | 2.6 | 2.6 | |
| Slightly Disagree | 1 | 2.6 | 2.6 | 5.1 | |
| Neutral | 4 | 10.3 | 10.3 | 15.4 | |
| Valid | Slightly Agree | 11 | 28.2 | 28.2 | 43.6 |
| Agree | 14 | 35.9 | 35.9 | 79.5 | |
| Agree Strongly | 8 | 20.5 | 20.5 | 100.0 | |
| Total | 39 | 100.0 | 100.0 | ||
| P2V2speed-limit | |||||
| Frequency | Percent | Valid Percent | Cumulative Percent | ||
| Disagree | 1 | 2.6 | 2.6 | 2.6 | |
| Slightly Disagree | 1 | 2.6 | 2.6 | 5.1 | |
| Neutral | 3 | 7.7 | 7.7 | 12.8 | |
| Valid | Slightly Agree | 9 | 23.1 | 23.1 | 35.9 |
| Agree | 17 | 43.6 | 43.6 | 79.5 | |
| Agree Strongly | 8 | 20.5 | 20.5 | 100.0 | |
| Total | 39 | 100.0 | 100.0 | ||
| P2V3road-rules | |||||
| Frequency | Percent | Valid Percent | Cumulative Percent | ||
| Disagree | 1 | 2.6 | 2.6 | 2.6 | |
| Slightly Disagree | 2 | 5.1 | 5.1 | 7.7 | |
| Neutral | 5 | 12.8 | 12.8 | 20.5 | |
| Valid | Slightly Agree | 8 | 20.5 | 20.5 | 41.0 |
| Agree | 12 | 30.8 | 30.8 | 71.8 | |
| Agree Strongly | 11 | 28.2 | 28.2 | 100.0 | |
| Total | 39 | 100.0 | 100.0 | ||