1. Introduction
he price of oil affects the global economy and geographical events, making oil price uncertain and unstable, because oil is a major source of energy [28]. In the application of computer science and time series mathematical theories to the oil and gas industries , the prediction of oil prices is still a challenge because oil falls under the categories of commodities which are easily affected by change in government policies and unpredictable natural or unnatural events. The oil market is complicated because, like the stock market, its features are neither linear nor stationary [3] [4]. Oil, an already volatile market, reached a flash point in 2020 accentuated by the coronavirus (COVID 19) pandemic which resulted in a sharp drop of price that affected the oil exporting countries. Fig. 1 is a pictorial view of an instance in the sharp drop in global oil prices as a result of the COVID 19 pandemic. Fig. 1 shows that oil collapsed to the lowest price in 18 years. Such a price drop negatively impacted on the economy of the nations that depend on oil as a major part of their gross domestic product (GDP) and nations that depend on oil for economy sustenance and survival. Such inadvertent and sharp drops in oil prices also have adverse effects on the performance of software systems designed for the forecasting of oil prices. Therefore, developing a proactive model capable of automation for the prediction of oil prices is of high significance and is worth the efforts. [12]. However, many of the available and popular technical indicators have proved unprofitable and disappointing to investors, often resulting not only in ordinary losses but in total loss of investment capital, in spite of the claims of their designers and developers. In this paper, a dynamic level technical indicator model for the forecasting of commodities' prices is proposed. The remaining part of this paper is organized as follows the next section is the background of study. This is, followed by the review of related works, the methodology and the implementation. Finally, the results and discussion are presented and followed by the conclusion and future works.
2. II.
3. Background of Study
Technical Indicators are primarily intended for displaying some graphical signals on a security charts for the purpose of guiding traders and users on appropriate trading decisions. These graphical signals are displayed through some calculated dependencies achievable through programming codes in a programming language suitable for the terminal employed for the security or commodity.
4. Related Works
Although many technical indicators exist, only few are documented publicly in the research community. Previous works relating to technical indicators are discussed in this section. Bartolucci et al [2] proposed a generalized version of moving average convergence and divergence by adopting the martingale and applied the indicator for the monitoring of crude oil prices. Nazário et al [3] gave the classification of technical analysis on stock market in a literature review. Using the combination of technical indicators and news articles as inputs, Vargas et al [5] applied deep learning for the prediction of daily directional stock price movement. They compared the performance of a hybrid model composed of a Convolutional Neural Network (CNN) for the financial news with Long Short-Term Memory (LSTM) for technical indicators. Chan and Teong [6] applied neural networks to enhance technical analysis positing that false breakout had been previously experienced with the use of technical analysis. Oriani and Coelho [7] evaluated the impact of a number of technical indicators on the stock market using multilayer perceptrons (MLP) but presented no model. Gholamiangonabadi et al [14] combined Principal Component Analysis, Stepwise Regression Analysis and Artificial Neural Networks for the performance evaluation of the technical indicators of an electrical industry stock exchange. Thawornwong et al [17] also focused on the application of neural networks for decision making in the stock market. Stankovi? [15] investigated the effectiveness of least square support vector machine and some traditional technical indicators such as MACD and Relative Strength Index (RSI) for financial series stock trend prediction and investment strategy optimization. Chong and Ng [18] simply tested and compared MACD with RSI using the Financial Times -Institute of Actuaries 30 (FT30) index of Mills. Rosillo [19] also simply tested the RSI, MACD, momentum and stochastic rules for technical analysis using the Spanish stock market. Almeida et al [16] analyzed some technical indicators using an algorithm based on differential evolution to generate Pareto fronts for each technical indicator to achieve multi-objective optimization. Chi and Peng [20] studied the relationship among various technical indicators and using self-organizing map and fuzzy neural network. On the prediction of oil prices, the diverse approaches proposed by other members of the research community include: the use of sentiment on news article [21], autoregressive integrated moving average (ARIMA) model [22], a hybrid of wavelet or Commodity Futures Prices and artificial neural networks [23] [25], deep learning based models [24], statistical learning method [26], time-varying approach [27], gray wave forecasting method and optimization via bagging ensemble models [29].
Most of the existing technical indicator models adopt the statistical approach while recent ones adopt deep learning methodology and they are limited in the diversity of application. Our proposed model creates programmable dynamic levels for price supports and resistances. The proposed model can be used both for trending and hedging markets. In addition, while most of the existing technical indicators were used for stock decision making, our proposed model focuses on the prediction of oil prices. These are some of the main contributions and novelty of this paper.
IV.
5. Methodology
The proposed model leverages on the overriding impact of support and resistance levels of the terminal charts and their effects on the system's profit. An algorithm was developed to capture, establish and indicate the support and resistance for different timeframes of the terminal charts and to dynamically move these levels as the price of the commodity changes. The relative movements of one minute (M1), five minutes (M5), fifteen minutes (M15), one hour (H1), four hour (H4) and daily (D1) timeframes during price trending, reversal and breakout were observed and studied over a period of time. The result of the research observation was then recommended for order placements and other trading decisions.
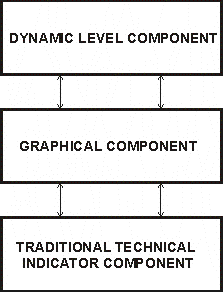
6. a) The Dynamic Level Technical Indicator Model
The The graphical component displays the various indicators with different object properties. This component sets the line color, width and style. While the changing values of the dynamic levels can be captured with program codes for auto-trading, manual trading depending on the positioning of the indicator lines for trading decision. The algorithm of the graphical component is shown below.
7. i. Algorithm for the graphical component
The algorithm of the graphical component of the dynamic level component given below for M15 resistance for(int b=0; b<2; b+=2) { ObjectDelete("LineNameLabel"+b); ObjectCreate("LineNameLabel"+b,OBJ_HLINE,0,0,MaxBuyPriceHigh15M); //MaxBuyPriceClose1H ObjectSet("LineNameLabel"+b,OBJPROP_COLOR,Aqua); ObjectSet("LineNameLabel"+b,OBJPROP_WIDTH,2); ObjectSet("LineNameLabel"+b,OBJPROP_RAY,False); }
The algorithm of the graphical component of the traditional technical indicator is given below for M15 resistance.
8. //---plot MaxBuyPriceHigh15M indicator_label "MaxBuyPriceHigh15M" indicator_type DRAW_LINE indicator_color clrAqua indicator_style STYLE_SOLID indicator_width 2 e) Research Observations and Model applications
It was observed in the course of this study that trending in the bullish direction occurs when the M5 line moves above the M15 line or the M15 line moves above the H1 line at the resistance level. Similarly, trending in the bearish direction occurs when the M5 line moves below the M15 line or the M15 line moves below the H1 line at the support level. Price breakout in the bullish direction occurs when the M15 line moves above the H4 line at the resistance level. In the same way, price breakout in the bearish direction occurs when the M15 line moves below the H4 line at the resistance level. These observations, which has not been stated in previous studies by the research community, produced positive results when implemented. They therefore, form part of the contribution to knowledge of this paper.
9. f) Materials
The experiments carried out in this study were performed with Meta Quote programming language installed on Intel(R) Core(TM) i3-2330M CPU @ 2.20GHz, 4 GB RAM, 64-bit Windows 8 operating system. The program was run on MetaTrader 4 terminal installed on a US based virtual private server.
V.
10. Implementation
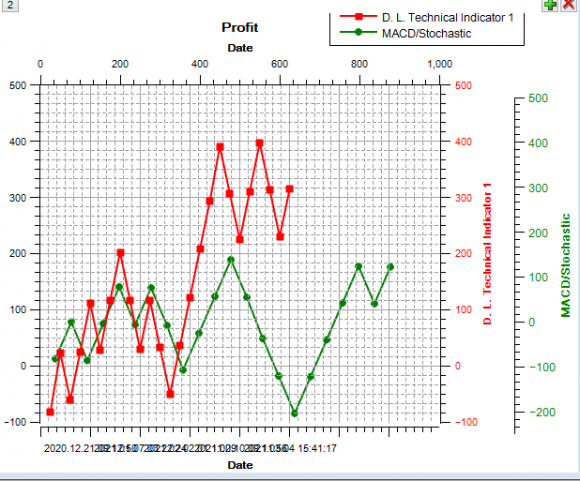
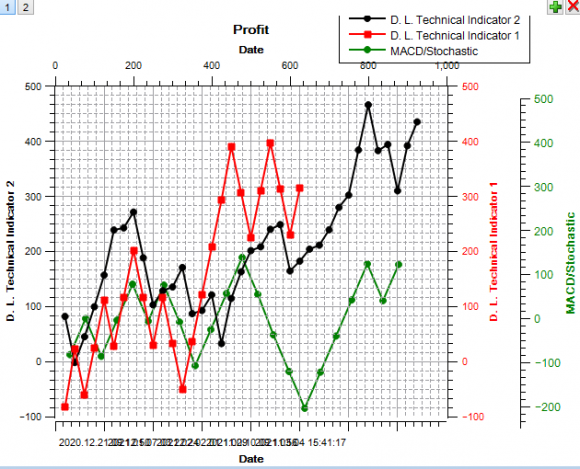
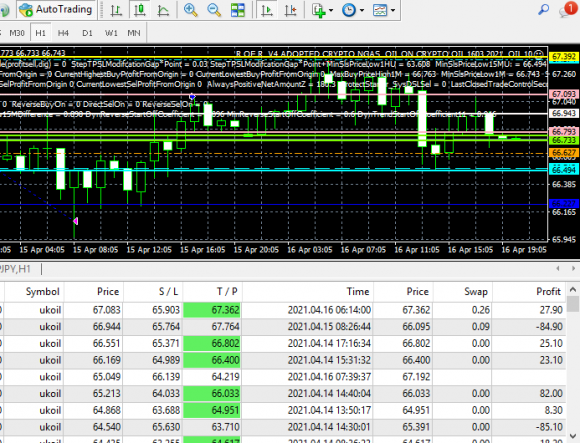
The proposed model was implemented for M5, M15, H1, H4 and D1 timeframes. The various properties of the indicator lines in the different timeframes implemented are shown in Table 1. The values of the dynamic level active array size, the line variable names at supports and resistances as well as the line color, line type and line width are shown in Table 1. Fig. 5 illustrates how the proposed model captured the exact support of the H4 with orange color, displayed using the H4 timeframe chart. The proposed technical indicator is implemented with the name "Dynamic Level 1" as shown in Fig. 5. The file name used for saving the indicator's program codes is displayed as "Dynamic Level 1.mq4" under indicators files' Listing in Fig. 3. The price of oil affects the global economy because oil is a major source of energy. However, the features of the oil market is neither linear nor stationary, making the prediction of oil price a challenge. In this paper, a dynamic level indicator model has been proposed for the forecasting of oil prices. The proposed model was deployed for the UK Oil on live trading for a period of three months and compared with MACD/ Stochastic Oscillator technical indicators which ran at the same period. The result showed that the proposed model is more profitable than MACD/Stochastic Oscillator indicators and therefore can be adopted for oil price prediction. In addition, the research observation of this paper introduces a novel method of price trend prediction based on the relative movements of the dynamic levels in the terminal charts.
Future works shall focus on the investigation of further possible profit optimization of the dynamic level technical indicator model.
![Fig. 1: Price developments of crude oil in US dollars, from 2000 until April 2020 Author ? ?: Department of Computer Science, Federal University of Petroleum Resources, Effurun. Delta State, Nigeria. e-mails: oyemade.david@fupre.edu.ng, enebeli.david@fupre.edu.ng Technical indicators, most of which adopt time series or deep learning solutions, are suitable for the prediction of oil prices [1] [5] [10] [11] [12]. However,](https://computerresearch.org/index.php/computer/article/download/2030/version/101411/2-A-Dynamic-Level-Technical-Indicator_html/25793/image-2.png)
![Fig. 2: Technical Indicator Creation -Passing values of indicator arrays via a buffer to a client terminal [13] Technical analysis refers to the use of technical indicators and historical data for trading decisions in contrast to the use of economic, political or geographical events [3]. The use of events for trading decisions is referred to as fundamental analysis. Technical analysis is a set of rules or charting that anticipates future prices based on the study of the basic security information such as open price, selling price, volume traded, amongst other information. Contemporary technical indicators can be classified into: Trend, Oscillators, Volumes and Bill Williams. Various technical indicators which fall under each can be seen in Fig. 3 which shows the technical indicators tree. Examples of such technical indicators include: Average Directional Movement Index, Bollinger Bands, Average True Range, Bears Power, Accumulative/ Distribution, Money Flow Index, Accelerator oscillator and Alligator.](https://computerresearch.org/index.php/computer/article/download/2030/version/101411/2-A-Dynamic-Level-Technical-Indicator_html/25795/image-4.png)


![c) Traditional Technical Indicator ComponentThe traditional technical indicator component uses buffers as explained in section 2. For every line displayed in a traditional technical indicator, a buffer is needed. The algorithm for the traditional technical indicator component at M15 resistance is given below.i. Algorithm for Traditional Technical Indicator Component Declare the array MaxBuyPriceHigh15MBuffer[] for the indicator buffer array Declare the array MaxBuyPriceHigh15MBuffer[] for the price at resistance SetIndexBuffer(6,MaxBuyPriceHigh15MBuffer) //initialize the buffer array Counted_bars IndicatorCounted(); // Number of counted bars i Bars-Counted_bars-1; // Index of the first uncounted while(i>=0) // Loop for uncounted bars { MaxBuyPriceHigh15MBuffer[i] ?MaxBuyPriceHigh15M; i--; // Calculating index of the next bar } d) The Graphical Component](https://computerresearch.org/index.php/computer/article/download/2030/version/101411/2-A-Dynamic-Level-Technical-Indicator_html/25800/image-9.png)
| Timeframe | Dynamic Level Active Array Size | Object Property Color | Object Type | Object Width | Line Variable Name at Support | Line Variable Name at Resistance |
| M1 | 4 | OBJ_HLINE | 2 | |||
| M5 | 5 | LawnGreen | OBJ_HLINE | 2 | MinSellPriceLow5M | MaxBuyPriceHigh5M |
| M15 | 60 | Aqua | OBJ_HLINE | 2 | MinSellPriceLow15M | MaxBuyPriceHigh15M |
| H1 | 72 | Yellow | OBJ_HLINE | 2 | MinSellPriceLow1H | MaxBuyPriceHigh1H |
| H4 | 126 | Orange | OBJ_HLINE | 2 | MinSellPriceLow4H | MaxBuyPriceHigh4H |
| D1 | 300 | Violet | OBJ_HLINE | 2 | MinSellPriceLowD1 | MaxBuyPriceHighD1 |