1. Introduction a) Background
he era of the Internet of Things (IoT) generates huge volumes of data collected from various heteregenous sources which may include mobile devices, sensors and social media. This Big Data presents tremendous challenges on the storage, processing and analytical capabilities. Cloud Computing provides a cost-effective and valid solution in support of Big Data storage and execution of data analytic applications. IoT requires both cloud computing environment to handle its data exchange and processing; and the use of artificial intelligence (AI) for data mining and data analytics. However, AI provides value-adding contributions in improving the traditional cybersecurity challenged by both the cloud vulnerability and the networking of IoT devices. Sadly, AI is also being used by hackers to threaten cybersecurity. A hybrid cybsecurity model which uses AI and Machine Learning (ML) techniques may mitigate against IoT cyber threats on cloud computing environments. As the number of IoT devices increases phenomenally, the volumes of cloud-based data and the degree of cybersecurity vulnerability increases astronomically with a high degree of complexity. The situation is exacerbated by the IoT devices that come with inadequate cybersecurity safeguards. Vulnerabilities in the IoT devices opens a window of opportunity for cyber crimes and other forms cybersecurity risks, especially among interconnected devices at now at household level.
The research paper is focused on the Performance of Machine Learning and Big Data Analytics paradigms in Cybersecurity and Cloud Computing platforms. The purpose of the research is to evaluate Machine Learning and Big Data Analytics paradigms for use in Cybersecurity. This is relevant due to the rapid advances in machine learning (ML) and deep learning (DL) as we explore the potency of efficient and cost-effective cloud computing platforms and services. Evaluation of the attacks and defenses using ML and Big Data paradigms is the key subject of this research paper. However, ML and DL techniques are resource intensive and require huge volumes of training data with excellent performance, as is often provided by computational resources such as high-performance graphics processing units (GPUs) and tensor processing units. Security issues related to virtualisation, containerization, network monitoring, data protection and attack detection are interrogated whilst strengthening AI/ML/DL security solutions that involve encryption, access control, firewall, authentication and intrusion detection and prevention systems at the appropriate Fog/Cloud level.
Cybersecurity consolidates the confidentiality, integrity, and availability of computing resources, networks, software programs, and data into a coherent collection of policies, technologies, processes, and techniques to prevent the occurrence of an attack [1]. Cybersecurity refers to a combination of technologies, processes and operations that are framed to protect information systems, computers, devices, programs, data and networks from internal or external threats, harm, damage, attacks or unauthorized access [2]. The major cybersecurity applications are intrusion detection and malware detection. The rapid advances in mobile computing, communications and mass storage architectures have precipitated the new phenomena of Big Data and Internet of Things (IoT).
The transformation and expansion of the cyberspace has resulted in an exponential growth in the amount, quality and diversity of data generated, stored and processed by networks and hosts. These changes have necessitated a radical shift in the technology and operations of cybersecurity to detect and eliminate cyber threats so that cybersecurity remains relevant and effective in mitigating costs arising from computers, networks and data breaches [2].
The Network Intrusion Detection Systems (NIDS) is a category of computer software that monitors system behaviour with a view to ascertain anomalous violation of security policies and distinguishes between malicious users and the legitimate network users [3]. The two taxonomies of NIDS are anomaly detectors and misuse network detectors. According to [4], the components in Intrusion Detection and Prevention Systems (IDPSs) can be sensors or agents, servers, and consoles for network management. Data over networks may be secured through the use of antivirus software, firewall, encryption, secure protocols, etc. However, hackers can always devise innovative ways of breaking into the network systems. An intrusion detection and prevention system (IDPS), shown on Figure 1 below, is placed inside the network to detect possible network intrusions and, where possible, prevent the cyber attacks. The key functions of the IDPSs are to monitor, detect, analyze, and respond to cyber threats.
The strength of the overall security in Cybersecurity is determined by the weakest link [5]. Access controls and security mechanisms should be encapsulated in the company objectives. Firewall protection has proved to be inadequate because of gross limitations against external threats [6].
2. Figure 1: Typical Intrusion detection system
Computers are instructed to learn through the process called Machine Learning (ML), a field within artificial intelligence (AI). Artificial intelligence (AI) is the simulating of human intelligence in machines, through programming computers to think and act like human beings [7].The main characteristic of ML is the automatic data analysis of large data sets and production of models for the general relationships found among data. ML algorithms require empirical data as input and then learn from this input. However, the amount of data provided is often more important than the algorithm itself. Deep Learning (DL), as a special category of ML, brings us closer to AI. ML algorithms as part of Artificial Intelligence (AI) can be clustered into supervised, unsupervised, semi-supervised, and reinforcement learning algorithms. The three classes of ML are as illustrated on Figure 2 below [8], and these are: Supervised learning: where the methods are given inputs labeled with corresponding outputs as training examples;
Unsupervised learning: where the methods are given unlabeled inputs;
Reinforcement learning: where data is in the form of sequences of observations, actions, and rewards. Supervised learning models are grounded on generating functions that maps big datasets (features) into desired outputs [10]. Unsupervised learning is seen as a mathematical process of minimizing redundancy or categorizing huge datasets based on likeness [7]. It is important to note that Machine Learning is a technique of big data analytics that includes programming analytical model construction [10]. The output of a machine learning model often includes perceptions and/or decisions. Big data analytics has emerged as a discipline of ways to analyze, systematically extract/mine information from, or otherwise deal or work with enormous or complex datasets which are large to be dealt with by traditional data-processing methodologies [7].
The transformation and expansion of the cyber space has led to the generation, use, storage and processing of big data, that is, large, diverse, complex, multidimensional and usually multivariate datasets [11]. According to [12], Big Data refers to the flood of digital data from many digital sources. The data types include images, geometries, texts, videos, sounds and combinations of each. [13] explained big data as the increase in volume of data that offers difficulty in storage, processing and analysis through the traditional database technologies. Big Data came into existence when the traditional relational database systems were not able to handle the unstructured data generated by organizations, social media, or from any other data generating source [14]. The characteristics of big data are volume, velocity, variety, veracity, vocabulary and value [11]. Big data has necessitated the development of big data mining tools and techniques widely referred to as big data analytics. Big data analytics makes use of analytic techniques such as data mining, machine learning, artificial learning, statistics, and natural language processing. In an age of transformation and expansion in the Internet of Things (IoT), cloud computing services and big data, cyber-attacks have become enhanced and complicated [15], and therefore cybersecurity events become difficult or impossible to detect using traditional detection systems [16], [17]. Big Data has also been defined according to the 5Vs as stipulated by [18] where:
? Volume refers to the amount of data gathered and processed by the organisation
? Velocity referring to the time required to do processing of the data ? Variety refers to the type of data contained in Big Data ? Value referring to the key important features of the data. This is defined by the added-value that the collected data can bring to the intended processes. ? Veracity means the degree in which the leaders trust the information to make a decision.
Big Data Analytics (BDA) can offer a variety of security dimensions in network traffic management, access patterns in web transactions, configuration of network servers, network data sources, and user credentials. These activities have brought a huge revolution in the domains of security management, identity and access management, fraud prevention and governance, risk and compliance. However, there is also a lack of in-depth technical knowledge regarding basic BDA concepts, Hadoop, Predictive Analytics, and Cluster Analysis, etc. With these limitations in mind, appropriate steps can be taken to build on the skills and competences on security analytics. There is lack of infrastructure to support such innovations, lack of skilled data scientists and lack of policies or legislation that promote such innovations.
The supervised machine learning algorithm which can be used for both classification or regression challenges is called the Support Vector Machine (SVM). The original training data can be transformed into a higher dimension where it becomes separable by using the SVM algorithm which searches for the optimal linear separating hyperplane. Estimations of the relationships among variables depends mainly on the statistical process of regression analysis. The independent variables determine the estimation target. The regression function can be linear as in linear regression, or a common sigmoid curve for the logistic function.
The easiest and simplest supervised machine learning algorithm which can solve both classification and regression problems is the k-nearest neighbors (KNN) algorithm. Both the KNN and SVM can be applied to finding the optimal handover solutions in heterogeneous networks constituted by diverse cells. Given a set of contextual input cues, machine learning algorithms have the capability to exploit the user context learned. The Hidden Markov Model (HMM) is a tool designed for representing probability distributions of sequences of observations. It can be considered a generalization of a mixture-based model, rather than being independent of each other. The list of supervised learning algorithms includes Regression models, Knearest neighbors, Support Vector Machines, and Bayesian Learning [39].
Common examples of generative models that may be learned with the aid of Bayesian techniques include, but are not limited to, the Gaussians mixture model (GM), expectation maximization (EM), and hidden Markov models (HMM) [3, p. 445]. In Table 1, we summarize the basic characteristics and applications of supervised machine learning algorithms.
Table 1: Various attack descriptions (Source: [7]) Attack Type Description DoS Denial of service: an attempt ot make a netwokr resource unavailable to its intended users; trmporairly interrupt services of a host connected to the Internet
3. Scan
A process that sends client requests to a range of server port addresses on a host to find an active port.
4. Local Access
The attacker has an account on the system in question and can use that account to attempt unauthorized tasks.
5. User to root
Attackers access a user account on the system and are able to exploit some vulnerability to gain root access to the system Data Attackers involve someone performing an action that they may be able to do on a given computer system, but that they are not allowed to do according to policy.
6. b) Statement of the problem
Firewall protection has proved to be inadequate because of gross limitations against external threats The fact is that the most network-centric cyberattacks are carried out by intelligent agents such as computer worms and viruses; hence, combating them with intelligent semi-autonomous agents that can detect, evaluate, and respond to cyberattacks has become a requirement [5]. The rapid development of computing and digital technologies, the need to revamp cyberdefense strategies has become a necessity for most organisations [6]. As a result, there is an imperative for security network administrators to be more flexible, adaptable, and provide robust cyber defense systems in real-time detection of cyber threats.
The key problem is to evaluate Machine Learning (ML) and Big Data Analytics (BDA) paradigms for use in Cybersecurity.
7. c) Purpose of study
The research is purposed to evaluate Machine Learning and Big Data Analytics paradigms for use in Cybersecurity.
8. d) Research objectives
The research objectives are to:
9. Literature Review a) Overview
Computers, phones, internet and all other information systems developed for the benefit of humanity are susceptible to criminal activity [5]. Cybercrimes consist of offenses such as computer intrusions, misuse of intellectual property rights, economic espionage, online extortion, international money laundering, non-delivery of goods or services, etc. [13]. Intrusion detection and prevention systems (IDPS) include all protective actions or identification of possible incidents, and analysing log information of such incidents [4]. [6] recommends the use of various security control measures in an organisation. Various attack descriptions from the outcome of the research by [7] are shown on Table 1. The monotonic increase in an assortment of cyber threats and malwares amply demonstrates the inadequacy of the current countermeasures to defend computer networks and resources. To alleviate the problems of classical techniques of cyber security, research in artificial intelligence and more specifically machine learning is sought after [1], [2]. To enhance the malware and cyber-attack detection rate, one can apply deep learning architectures to cyber security.
10. b) Classical Machine Learning (CML)
Machine Learning (ML) is a field in artificial intelligence where computers learn like people. We present and briefly discuss the most commonly used classical machine learning algorithms.
11. i. Logistic Regression (LR)
As an idea obtained from statistics and created by [17], logistic regression is like linear regression, yet it averts misclassification that may occur in linear regression. Unlike linear regression, logistic regression results are basically either '0' or '1'. The efficacy of logistic regression is mostly dependent on the size of the training data.
ii. Naive Bayes (NB) Naive Bayes (NB) classifier is premised on the Bayes theorem which assumes independence of features. The independence assumptions in Naive Bayes classifier overcomes the curse of dimensionality.
12. iii. Decision Tree (DT)
A Decision tree has a structure like flow charts, where the root node is the top node and a feature of the information is denoted by each internal node. The algorithm might be biased and may end up unstable since a little change in the information will change the structure of the tree.
13. iv. K-Nearest Neighbor (KNN)
K-Nearest Neighbor (KNN) is a non-parametric approach which uses similarity measure in terms of distance function classifiers other than news cases. KNN stores the entire training data, requires larger memory and so is computationally expensive.
14. v. Ada Boost (AB)
Ada Boost (AB) learning algorithm is a technique used to boost the performance of simple learning algorithms used for classification. Ada Boost constructs a strong classifier using a combination of several weak classifiers. It is a fast classifier and at the same time can also be used as a feature learner. This may be useful in tasks that use imbalanced data analysis.
15. vi. Random Forest (RF)
Random forest (RF), as an ensemble tool, is a decision tree derived from a subset of observations and variables. The Random Forest gives better predictions than an individual decision tree. It uses the concept of bagging to create several minimal correlated decision trees.
16. vii. Support Vector Machine (SVM)
Support Vector Machine (SVM) belongs to the family of supervised machine learning techniques, which can be used to solve classification and regression problems. SVM is a linear classifier and the classifier is a hyper plane. It separates the training set with maximal margin. The points near to the separating hype plane are called support vectors and they determine the position of hyper plane.
17. c) Modern Machine Learning
Deep learning is a modern machine learning which has the capability to take raw inputs and learns the optimal feature representation implicitly. This has performed well in various long standing artificial intelligence tasks [3]. Most commonly used deep learning architectures are discussed below in detail.
18. i. Deep Neural Network (DNN)
An artificial neural network (ANN) is a computational model influenced by the characteristics of biological neural networks. The family of ANN includes the Feed forward neural network (FFN), Convolutional neural network and Recurrent neural network (RNN). FFN forms a directed graph in which a graph is composed of neurons named as mathematical unit. Each neuron in i th layer has connection to all the neurons in i + 1 th layer.
Each neuron of the hidden layer denotes a parameter h that is computed by
h i (x) = f (w i T x + b i ) (1) hii: Rdi?1 ? Rdi (2) f : R ? R(3)Where w i ? Rd×d i ?1 , b i ? Rd i , d i denotes the size of the input, f is a non-linear activation function, ReLU.
The traditional examples of machine learning algorithms include Linear regression, Logistic regression, Linear discriminant analysis, classification and regression trees, Naïve bayes, K-Nearest Neighbour (K-NN), Kmeans clustering Learning Vector Quantization (LVQ), Support Vector Machines (SVM), Random Forest, Monte Carlo, Neural networks and Qlearning. Take note that:
? Supervised Adaptation is carried out in the execution of system at every iteration. ? Unsupervised Adaptation follows trial and error method. Based on the obtained fitness value, computational model is generalized to achieve better results in an iterative approach.
ii. The future of AI in the fight against cybercrimes Exeriments showed that NeuroNet is effective against low-rate TCP-targeted distributed DoS attacks. [19] presented the Intrusion Detection System using Neural Network based Modeling (IDS-NNM) which proved to be capable of detecting all intrusion attempts in the network communication without giving any false alerts [20].
The characteristics of NIC algorithms are partitioned into two segments such as swarm intelligence and evolutionary algorithm. The Swarm Intelligence-based Algorithms (SIA) are developed based on the idea of collective behaviours of insects in colonies, e.g. ants, bees, wasps and termites. Intrusion detection and prevention systems (IDPS) include all protective actions or identification of possible incidents and analysing log information of such incidents [4].
19. d) Big Data Analytics and Cybersecurity
Big Data Analytics requires new data architectures, analytical methods, and tools. Big data environments ought to be magnetic, which accommodates all heterogeneous sources of data. Instead of using mechanical disk drives, it is possible to store the primary data-base in silicon-based main memory, which improves performance. According to [21], there are four critical requirements for big data processing. The first requirement is fast data loading. The second requirement is fast query processing. The «Map» function in Hadoop accordingly partitions large computational tasks into smaller tasks, and assigns them to the appropriate key/value pairs.
Behavioral analytics provide information about the behavioral patterns of cybersecurity events or malicious data [2]. Forensics analytics locate, recover and preserve reliable forensic artefacts from specifically identified cybersecurity events or attacks [22]. Forecast analytics attempt to predict cybersecurity events using forecast analytics models and methodologies [23]. Threat intelligence helps to gather threats from big data, analyze and filter information about these threats and create an awareness of cybersecurity threats [2].
The situation awareness theory postulated by [24] posits that the success of a cybersecurity domain depends on its ability to obtain real-time, accurate and complete information about cybersecurity events or incidents [20]. The situation awareness model consists of situation awareness, decisions and action performance as shown in Figure 3.
There is consensus in prior literature that cyber security has evolved to become a problem for big data analytics. This is due to the understanding that the transformation and expansion of the cyberspace [16] has rendered traditional intrusion detection and malware detection systems obsolete. Further, even the data mining models that have been used in the past are no longer sufficient for the challenges in cyber security [16].
20. Figure 3: Simplified Theoretical Model Based on Situation Awareness
A big data analytics model for cybersecurity can be evaluated on the basis of its agility and robust [16].
According to [25], Big Data is defined not only by the amount of the information that it delivers but also by its complexity and by the speed that it is analyzed and delivered. With reference to [26], Big Data can be defined as a multi-faced data which combines the following characteristics: Veracity, Variety, Volume, Velocity and Value.
21. e) Advances in Cloud Computing
Cloud computing is about using the internet to access someone else's software running on someone else's hardware in someone else's data center [27]. Cloud Computing is essentially virtualized distributed processing, storage, and software resources and a service, where the focus is on delivering computing as a on-demand, pay-as-you-go service. On-demand self-service: A consumer can unilaterally provision computing capabilities such as server time and network storage as needed automatically, without requiring human interaction with a service provider.
22. Broad network access: Heterogeneous client platforms available over the network come with numerous capabilities that enable provision of network access.
Resource pooling: Computing resources are pooled together in a multi-tenant model depending on the consumer demand in a location independent manner.
23. Situational Awareness
Rapid elasticity: This is when unlimited capabilities are rapidly and elastically provisioned or purchased to quickly scale out; and rapidly released to quickly scale in.
Measured service: A transparent metering capability can be automatically controlled and optimized in cloud systems at some level of abstraction appropriate to the type of service. ii. Platform as a service (PaaS) PaaS provides to the consumer infrastructure for third-party applications. Just like in SaaS the consumer does not manage or control the underlying cloud infrastructure including network, servers, operating systems, or storage, but does have control over the deployed applications and possibly configuration settings for the application-hosting environment [29]; [32]. Examples include Windows Azure, Apache Stratos, Google App Engine, Cloud Foundry, Heroku, AWS (Beanstalk) and Open Shift [33] & [34]. PaaS provides faster and more frequent delivery of functionality for the sake of direct support for business agility. PaaS provides an enabling environment for a consumer to run applications. A PaaS Cloud should be able to support various programming models for different types of Programming. PaaS is a Cloud Computing service that offers a computing platform and solution stack for users, and this may include the following:
? Language ? Operating System (OS) ? Database ? Middleware ? Other applicationsiii. Infrastructure as a service (IaaS) This provisions processing, networks, storage, and other essential computing resources on which the consumer is then able to install and run arbitrary software, that can include operating systems (Virtual machines (VM), appliances, etc.) and applications [29]; [32]. Common global examples include Amazon Web Services (AWS), Cisco Metapod, Microsoft Azure, Rackspace and the local ones include TelOne cloud services and Dandemutande [33]. IaaS is a Cloud service that allows existing applications to run on its hardware. It rents out resources dynamically wherever they are needed.
24. Services include:
The three commonly-used cloud deployment models are private, public, and hybrid. An additional model is the community cloud. However, this is less commonly used. In a Cloud context the term deployment basically refers to where the software is made available, in other words where it is running.
25. i. Private Cloud
The private cloud is normally either owned or exclusively used by a single organization. The services and infrastructure are permanently kept on a private network, the hardware and software are dedicated solely to the particular organisation. The service provider or the particular organization may manage the physical infrastructure. The major advantage of this model is the improved security as resources are not shared with others thereby allowing for higher levels of control and security [35]. The cloud infrastructure is provisioned for use by the general public. The public cloud is sold to the public, as a mega-scale infrastructure, and is available to the general public. [12] further clarifies that cloud services are provided on a subscription basis to the public. It is typically based on a pay-per-use model. The advantages include lower costs, near-unlimited scalability and high reliability [35].
Examples include Amazon (EC2), IBM's Blue Cloud, Sun Cloud, Google App Engine and Windows Azure [37].
26. iii. Hybrid Cloud
A hybrid cloud model is a mix of two or more cloud deployment models such as private, public or hybrid [36]; [38]. This model requires determining the best split between the public and private cloud components. The advantages include control over sensitive data (private cloud), flexibility, i.e. ability to scale to the public cloud whenever needed and lastly allows for ease transitioning to the cloud through gradual migration [35]. The use of standardized or proprietary technology allows for data and application portability [39].
27. iv. Community Cloud
This model is provisioned for exclusive use by a particular community of consumers bound by shared interests (e.g., policy and compliance considerations, mission and security requirements). A community cloud shares computing resources among several organizations, and can be managed by either organizational IT resources or third-party providers [29]. A typical example is the U.S.-based exclusive IBM Soft Layer cloud which is dedicated for use by federal agencies only. This approach builds confidence in the platform, which cloud consumers will use to process their sensitive workloads [37].
v. Cloud computing benefits Cloud computing services are delivered when they are needed in the quantity needed at a certain time. Cloud computing has many benefits for the organizations and these include cost savings, scalability, anytime anywhere access, use of latest software versions, energy saving and quick rollout of business solutions. The cost effectiveness and efficiency of the cloud platforms is tempting most organizations to migrate to the cloud and enjoy a wide range of general benefits [40] which according to [41] include: Traditionally, these networks rely on dedicated hardware-based network equipment and their functions to provide communication services. However, this reliance is becoming increasingly inflexible and inefficient, especially in dealing with traffic bursts for example during large crowd events. NFV strives to overcome current limitations by (1) implementing network functions in software and (2) deploying them in a virtualized environment. The resulting virtualized network functions (VNFs) require a virtual infrastructure that is flexible, scalable and fault tolerant.
The growing maturity of container-based virtualization and the introduction of production-grade container platforms promotes containers as a candidate for the implementation of NFV infrastructure (NFVI). Containers offer a simplified method of packaging and deploying applications and services. Virtualization is basically making a virtual image or "version" of something usable on multiple machines at the same time. This is a way of managing the workload by transforming traditional computing to make it more scalable, efficient and economical. Virtualization can be applied to hardware-
28. h) Why Virtualization?
With virtualization, one can attain better utilization rate of the resources of the service providers, increased ROI for both the service providers and the consumers, and promotes the green IT by reducing energy wastage. Virtualization technology has the drawbacks of the chance of a single point of failure of the software achieving the virtualization and the performance overhead of the entire system due to virtualization. Virtualization in general has tremendous advantages. The advantages of virtual machines are as follows:
? Where the physical hardware is unavailable, run the operating systems, ? Easier to create new machines, backup machines, etc., ? Use of "clean" installs of operating systems and software for software testing ? Emulate more machines than are physically available, ? Timeshare lightly loaded systems on one host, ? Debug problems (suspend and resume the problem machine), ? Easy migration of virtual machines, ? Run legacy systems! Two or more CPUs can work together on the same chip in multicore technology as a single integrated circuit (IC). These single ICs are called a die. Multicore technology can be used to speed up the processing in a multitenant cloud environment. Multicore architecture has become the recent trend of high-performance processors, and various theoretical and case study results illustrate that multicore architecture is scalable with the number of cores.
Most of the software vendors raised a complaint that their application is not supported in a virtual state or will not be supported if the end-user decides to virtualize them. To accommodate the needs of the industry and operating environment, to create a more efficient infrastructure -virtualization process has been modified as a powerful platform, such that the process virtualization greatly revolves around one piece of very important software. This is called a hypervisor. Thus, a VM must host an OS kernel.
29. i) Compare and Contrast Between Virtualization and Containerization
Virtualization allows the running of multiple operating systems on a single physical system and share the underlying hardware resources. Virtualization entails abstraction and encapsulation. However, Cloudsrely heavily on virtualization, whereas Grids do not rely on virtualization as much as clouds. In Virtualization, a hypervisor is a piece of computer software that creates and runs virtual machines.
Instead of installing the operating system as well as all the necessary software in a virtual machine, the docker images can be easily built with a Dockerfifile since the hardware resources, such as CPU and memory, will be returned to the operating system immediately. Therefore, many new applications are programmed into containers. Cgroups allow system administrators to allocate resources such as CPU, memory, network, or any combination of them, to the running containers. This is illustrated in Figure 7 below.
30. Virtualization
Virtualization is the optimum way to enhance resource utilization in efficient manner. It refers to the act of creating a virtual (similar to actual) variations of the system. Physical hardware is managed with the help of software and converted into the logical resource that will be in a shared pool or can be used by the privileged user. This service is known as VMs we can say Infrastructure as a service. Virtualization is the base of any public and private cloud development. Most of the public cloud providers such as Amazon EC2, Google Compute Engine and Microsoft Azure leverage virtualization technologies to power their public cloud infrastructure [1]. The core component of virtualization is Hypervisors.
31. Hypervisor
It is a software which provides isolation for virtual machines running on top of physical hosts. The thin layer of software that typically provides capabilities to virtual parti-tioning that runs directly on hardware, It provides a potential for virtual partitioning and responsible for running multiple kernels on top of the physical host. This feature makes the application and process isolation very expensive. There will be a big impact if computer resources can be used more efficiently. The most popular hypervisors today are VMware, KVM, Xen, and HyperV.
Basically, a container is nothing but more than a virtual file system which are isolated with some Linux kernel features, such as namespaces and process groups, from the main physical system. Through containers framework it offers an environment as close as desirable one as we want from a VM but without the overhead that comes with running on an another kernel and simulating all the hardware. Due to lightweight nature of containers, more containers can run per host than virtual machines per host. Unlike containers, virtual machine require emulation layers (either software or hardware), which consume more resources and add additional overhead.
Containers are different from Virtualization with respect to the following aspects: 1. Simple: Easy sharing of a hardware resources clean command line interface, simple REST API. 2. Fast:-Rapid provisioning, instant guest boot, and no virtualization overhead so as fast as bare metal. 3. Secure: Secure by default, combine all available kernel security feature with App Armor, user namespaces, SECCOMP. 4. Scalable: The quality-of-service may be broadcast from the from a single container on a developer laptop to a container per host in a data centre. This is also includes remote image services with Extensible storage and networking. 5. Control groups (cgroups): This is a kernel-provided mechanism for administration, grouping and tracking through a virtual file system. Docker containers share the operating system and important resources, such as depending libraries, drivers or binaries, with its host and therefore they occupy less physical resources.
32. III.
33. Research Methodology a) Presentation of the methodology
The Pragmatism paradigm was used in this research and this is intricately related to the Mixed Methods Research (MMR).
Philosophers inclined to the pragmatic paradigm subscribe to the worldview that says it is impossible to access the truth of the real world by employing a single scientific method as supported by the Positivist paradigm or construct social reality under Interpretivist paradigm. In this research, an Interpretivist or Constructivist paradigm was used, as is illustrated on Table 2 below. Cybersecurity is a huge area for consideration and in order to address problems within it, there is need for contextualisation. This is a clear indication that there are multiple realities out there in the world of cybersecurity as supported by the Interpretivist paradigm.
The Research methodology is a way of solving a research problem thoroughly and meticulously and includes steps followed in carrying out the research and the reasoning behind [52]. Research methodology can also be viewed as a procedural or step by step outline or framework within which research is done. Research methodology can be quantitative, qualitative or mixed. Table 3 below shows the differences between qualitative and quantitative research methodologies. The Mixed Methods Research methodology was used. In a mixed methods methodology the researcher mixes both qualitative and quantitative data and employs the practices of both qualitative and quantitative research. It is also underpinned by the pragmatic paradigm.
34. Table 3: Differences between qualitative and quantitative methodologies
Difference with respect to:
Quantitative methodology Qualitative methodology
35. Supporting philosophy
Rationalism. Humans acquire knowledge through their capacity to reason.
36. Empiricism. Humans acquire knowledge through sensory experiences
37. Approach to inquiry
Structured or rigid /predetermined methodology Unstructured /flexible methodology
38. Main purpose of investigation To quantify the extend of variation in a situation or phenomenon
To describe variation in a phenomenon or situation
39. Measurement of variables Emphasis is on some form of either measurement or classification of variables
40. Emphasis is on the description of variables Sample size
Emphasis is put on a greater sample size Fewer cases
41. Focus of inquiry
Narrows focus in terms of extent of inquiry but draws together required information from a bigger number of respondents Covers multiple issues but draws together required information from a smaller number of respondents
42. Data analysis
Variables are put into frequency distributions or other statistical procedures
Responses or observational data is used to identify themes and their descriptions
43. Communication of findings
Organisation is more analytic in nature, drawing inferences and conclusions and testing strength between variables and their relationship
Organisation is more descriptive and narrative in nature Source: [51] i.
44. Research approach and philosophy Research approach
The researcher adopts a qualitative approach in form of focus group discussion to research. Since the analysis is done to establish differences in data analytics models for cybersecurity without the necessity of quantifying the analysis [42] .
45. Research philosophy
The researcher adopts a postmodern philosophy to guide the research. Firstly the researcher notes that the definition, scope and measurement of cybersecurity differs between countries and across nations [15]. Further, the post-modern view is consistent with descriptive research designs which seek to interpret situations or models in their particular contexts [43].
46. ii. Research design and methods
47. Research design
The researcher adopts a descriptive research design since the intention is to systematically describe the facts and characteristics of big data analytics models for cybersecurity. The purpose of the study is essentially an in-depth description of the models [42].
48. Research methods
A case study research method was adopted in this study. In this respect each data analytics model for cybersecurity is taken as a separate case to be investigated in its own separate context [43]. Prior research has tended to use case studies in relation to the study of cybersecurity [15]. However, the researcher develops a control case that accounts for an ideal data analytics model for cybersecurity for comparative purposes.
49. b) Population and sampling i. Population
The research population for the purpose of this study consists of all data analytics models for cybersecurity that have been proposed and developed in literature, journals, conference proceedings and working papers. This is consistent with previous research which involves a systematic review of literature [21].
50. ii. Sample
The researcher identified two data analytics models or frameworks from a review of literature and the sample size of 8. Eight participants in total were interviewed. However, while this may be limited data, it will be sufficient for the present needs of this study. Research in future may review more journals to identify more data analytics models which can be applied to cybersecurity.
51. c) Sources and types of data
The researcher uses secondary data in order to investigate the application of data analytics models in cybersecurity.
52. d) Model for analysis
In analyzing the different data analytics models for cybersecurity the researcher makes reference to the characteristics of an ideal data analytics model for cybersecurity. In constructing an ideal model, the researcher integrates various literature sources. The basic framework for big data analytics model for cybersecurity consists of three major components which are big data, analytics, and insights [16]. However, a fourth component may be identified as prediction (or predictive analytics) [21]). This is depicted in Figure 8 below:
53. Big data
The first component in the big data analytics framework for cybersecurity is the availability of big data about cybersecurity. Traditional sources of big data are systems logs and vulnerability scans [16]. However, sources of big data about cybersecurity have extended to include computer-based data, mobile-based data, physical data of users, human resources data, credentials, one-time passwords, digital certificates, biometrics, and social media data [11]. Some authors identify sources of big data about cybersecurity as business mail, access control systems, CRM system and human resources system, a number of pullers in linked data networks, intranet/ internet and IIoT/IoT, collectors and aggregators in social media networks and external news tapes [23]. Big data about cybersecurity should be imported from multiple sources to ensure effectiveness in detection and prediction of possible threats [17]. Further, some authors specify the characteristics of security data as consisting of heterogeneous format, diverse semantic and correlation across data sources and classify them into categories for example non-semantic data, semantic data and security knowledge data [17].
54. Big data analytics
The address the concerns of big data about cybersecurity, more robust big data analytics models for cybersecurity have been developed in data mining techniques and machine learning [16]. Big data analytics employ data mining reactors and algorithms, intrusion and malware detection techniques and vector machine learning techniques for cybersecurity [16]. However, it has been observed that adversarial programs have tended to modify their behavior by adapting to the reactors and algorithms designed to detect them [16]. Further, intrusion detection systems are faced with challenges such as unbounded patterns, data nonstationarity, uneven time lags, individuality, high false alarm rates, and collusion attacks [21]. This necessitates a multi-layered and multi-dimensional approach to big data analytics for cybersecurity [17], [2]. In other words an effective big data analytics model for cybersecurity must be able to detect intrusions and malware at every layer in the cybersecurity framework.
55. Insights for action
Big data analytics for cybersecurity should be able provide prioritized and actionable insights to cybersecurity personnel. For example setting up effective network defenders that are able to detect flaws in the network and be able to trace the source of threats or attacks [16]. Alternatively, cybersecurity personnel may update existing network defenders in light of new prioritized insights about the cybersecurity system [16].The goal of analysts should be to maximize utility derived from the cybersecurity system.
56. Predictive analytics
Predictive analytics refer to the application of a big data analytics model for cybersecurity to derive, from current cybersecurity data, the likelihood of a cybersecurity event occurring in future [21]. In essence, a data analytics model for cybersecurity should be able to integrate these components if it is to be effective in its major functions of gathering big data about cybersecurity, analyzing big data about cybersecurity threats, providing actionable insights and predicting likely future cybersecurity incidents.
57. e) Validity and Reliability
The researcher solicited comments from peers on the emerging findings and also feedback to clarify the biases and assumptions of the researcher to ensure internal validity of the study [43]. The researcher also reliability or consistency in research findings by explaining in detail the assumptions and theories underlying the study [43].
58. f) Summary of research methodology
In section 3, the researcher developed appropriate methodology for investigating the ideal data analytics models for cybersecurity.
59. g) Possible Outcomes
The expected accuracy rate for the research should be according to Table 4 below, which shows the international benchmark. The IDS is divided into either as a Host IDS (HIDS) or as a Network IDS (NIDS). Analysis of the network traffic can be handled by a NIDS which distinguishes the unlicensed, illegitimate and anomalous behavior on the network. Packets traversing through the network should generally be captured by the IDS using network taps or span port in order to detect and flag any suspicious activity [10]). Anomalous behavior on the specific device or malicious activity can be effectively detected by a device specific IDS. The vulnerability of networks and susceptibility to cyber attacks is exacerbated by the use of wireless technology [12].
The gross inadequacies of classical security measures have been overtly exposed. Therefore, effective solutions for a dynamic and adaptive network defence mechanism should be determined. Neural networks can provide better solutions for the representative sets of training data [12]. [12] argues for the use of ML classification problems solvable with supervised or semi-supervised learning models for the majority of the IDS. However, the one major limitation of the work done by [12] is on the informational structure in cybersecurity for the analysis of the strategies and the solutions of the players.
Autonomous robotic vehicles attract cyber attacks which prevent them from accomplishing the intrusion prevention mission. Knowledge-based and vehicle-specific methods have limitations in detection which is applicable to only specific known attacks [3]. The attack vectors of the attack scenarios used by [3] is shown on Figure 11 below. In this experiment, the system is allowed to undertake several missions by the robotic vehicle which diverts the robotic vehicle testbed. The practical experimental setup for the attack vectors used is shown on Figure 12 below. Table 5 shows a comparison of the data mining techniques that can be used in intrusion detection.
Intrusion attack classification requires optimization and enhancement of the efficiency of data mining techniques. The pros and cons of each algorithm using the NSL-KDD dataset are shown on Table 6 below.
Table 6: Performance of Support Vector Machines, Artificial Neural Network, K-Nearest Neighbour, Naive-Bayes and Decision Tree Algorithms An intrusion detection system determines if an intrusion has occurred, and so monitors computer systems and networks, and the IDS raises an alert when necessary [4]. However, [4] addressed the problems of Anomaly Based Signature (ABS) which reduces false positives by allowing a user to interact with the detection engine and raising classified alerts. The advantages and disadvantages of ABSs and SBSs are summarised on table, Table 7, below.
60. Table 7:
Advantages and disadvantages of ABSs and SBSs models (Source: [4])
An IDS must keep up track of all the data, networking components and devices involved. Additional requirements must be met when developing a cloud-based intrusion detection system due to its complexity and integrated services.
61. b) Support vector machine
Support Vector Machine is a classification artificial intelligence and machine learning algorithm with a set containing of points of two types in X dimensional place. Support vector machine generates a (X-1) dimensional hyperplane for separating these points into two or more groups using either linear kernel or nonlinear kernel functions [7]. Kernel functions provides a method for polynomial, radial and multi-layer perception classifiers such as classification of bank performance into four clusters of strong, satisfactory, moderate and poor performance. The class of bank performance is defined by the function Performance class = ( )
w x f . = ( ) ? j j j w x fWhere x ?? is the input vector to the support vector classifier and w ???? is the real vector of weights and f is the function that translates the dot product of the input and real vector of weights into desired classes of bank performance. w ???? Is learned from the labeled training data set.
62. c) KNN algorithm
The K-NN algorithm is a non-parametric supervised machine learning technique that endeavors to classify a data point from given categories with the support of the training dataset [7]. Predictions are performed for a new object (y) by searching through the whole training dataset for the K most similar instances or neighbors. The algorithm does this by calculating the Euclidean distance as follows:
63. ? =
Where X s is the standardized value, X is the instance measure, mean and s.d are the mean and standard deviation of instances. Lower values of K are sensitive to outliers and higher values are more resilient to outliers and more voters are considered to decide the prediction.
64. d) Multi Linear Discriminant Analysis (LDA)
The Linear Discriminant Analysis is a dimensionality reduction technique. Dimensionality reduction is the technique of reducing the amount of random variables under consideration through finding a set of principal variables [7] which is also known as course of dimensionality. The LDA calculates the separability between n classes also known as betweenclass variance. Let D b be the distance between n classes.
65. (
)(
) T i g i i i b x x x x N D ? ? = ? =1Where x the overall is mean, i
x and i N are the sample mean and sizes of the respective classes. The withinclass variance is then calculated, which is the distance between mean and the sample of every class. Let S y be the within class variance.
( )
( )( ) 2 , 1 , 1 1 i j i g t N j i j i i g t i y X X X X S N S i ? ? = ? = ?? ? = =The final procedure is to then construct the lower dimensional space for maximization of the seperability between classes and the minimization of within class variance. Let P be the lower dimensional space.
66. e) Random Forest Classifier
The Random Forest classifier is an ensemble algorithm used for both classification and regression problems. It creates a set of decision trees from a randomly selected subset of the training set [7]. It then makes a decision by aggregating the votes from individual decision trees to decide the final class of an instance in the classification problem. The tree with higher error rates are given low weight in comparison to other trees increasing the impact of trees with low error rate.
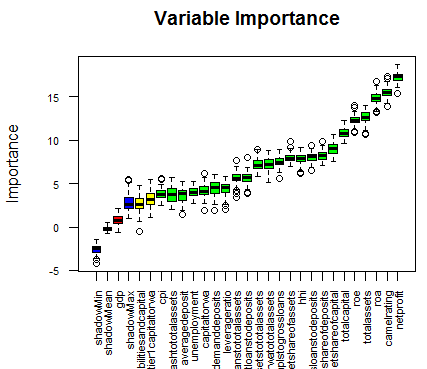
67. f) Variable importance
Variable importance was implemented using the Boruta algorithm to improve model efficiency. The Boruta algorithm endeavors to internment all the key, interesting features existing in the dataset with respect to an outcome variable. The diagram below shows that net profit is the most significant feature, followed by ROA, total assets, ROE and other variables depicted below in Figure 13.
68. Figure13: Boruta Algorithm important features
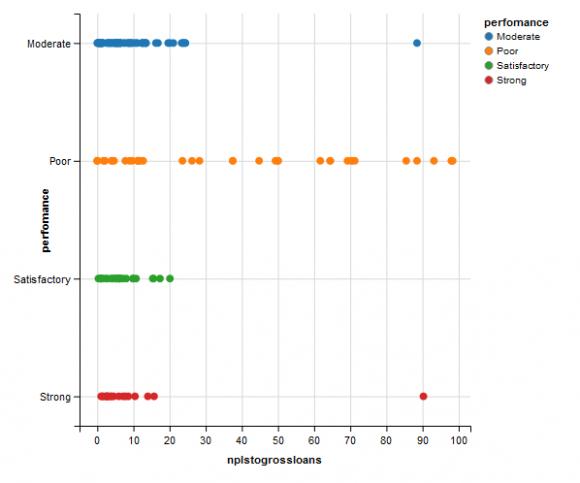
The next procedure was fitting these variable into our algorithms and hence evaluating their performance using the metrics discussed in the models section. The Boruta algorithm also clusters banks on important variable as shown below in Figure 14 for effective risk management and analysis. Before we discuss the results of our models. It is imperative to discuss the distribution of our dataset. We classify bank performance into four classes which are strong, satisfactory, moderate and poor performing banks. A strongly performing bank is the one with incredible CAMELS indicators. Its profitability indicators are high, the management quality is top of the class, less sensitive to market movements with a high quality asset base. A satisfactory bank is the one with acceptable but not outstanding performance.
The CAMELS indicators are quite okay for such bank. Moderate performance is the one characterized by fundamental weakness or imperfections. A poorly performing bank is the one whose performance is below standard expectations or defective and hence can be categorized as an already failed bank. Our dataset comprises of thousands of records from banking institutions returns. The distribution of performance classes is shown on the diagram below. We can see that strong banks comprise of 12.9%, satisfactory banks 15.1%, moderate banks 47.5% and poor banks 24.5%. Figure 15 visualizes the effectiveness of Boruta algorithm in determining the most important variables that determines the condition of a bank.
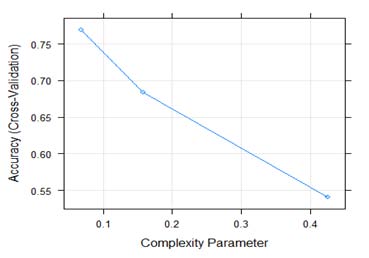
69. Figure 15: Distribution of the big dataset h) Classification and Regression Trees (CART)
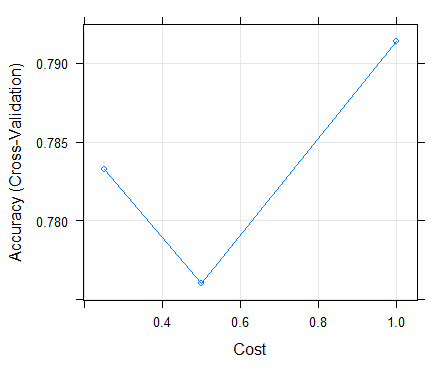
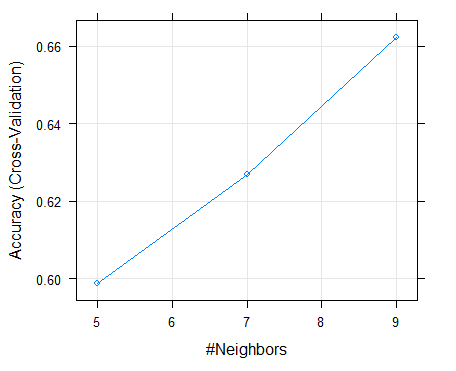
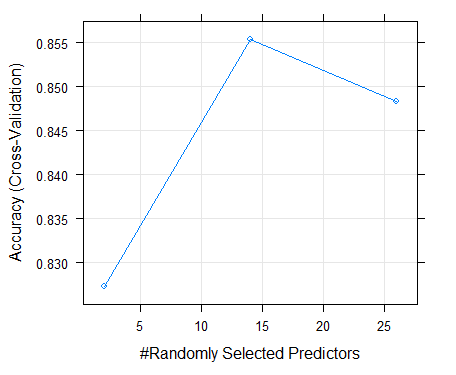
Table 8 below shows the performance results of our CART algorithm in predicting bank failure on the training set. The algorithm's level of accuracy on the training dataset was 82.8%. The best tune or complexity parameter of our optimal model was 0.068. The Kappa statistic was 75% envisaging that our classifier was effective as also shown with the Kappa SD of 0.07 in the classification of bank categories. On the test dataset, the algorithm achieved an accuracy level of 92.5% and a kappa of 88.72%. The algorithm only misclassified 2 instance as moderate and 1 as satisfactory. The accuracy of the CART model based on the complexity parameters of different test runs is shown on Figure 16 below. The complexity parameter or the best tune parameter of 0.068 optimized the model performance. The accuracy level of the SVM model on the training dataset was 79.1% in predicting bank solvency as shown in table 9. The best tune sigma and cost values of our highly performing model where 0.05 and 1 as shown on Figure 19 below. The Kappa statistic and the Kappa SD where 67.9% and 0.13 respectively. On the test dataset, the algorithm achieved an accuracy level of 92.5% and a kappa of 88.54%. The algorithm only misclassified 3 instance as moderate in comparison to the CART algorithm. The level of accuracy on the training dataset was 66.2%. The best tune parameter for our model was k=9 or 9 neighbors as shown on the accuracy curve in Figure 18 below. The Kappa statistic and the Kappa SD where 47.2% and 0.17 respectively. On the test dataset, the algorithm achieved an accuracy level of 67.5% and a kappa of 49%. The algorithm was not highly effective in classifying bank performance in comparison to other algorithms. On the training set, the accuracy of our random forest was 85.5% as designated in table 12. The best tune parameter for our model was the mtry of 14 which is the number of randomly selected predictors in constructing trees as shown on Figure 19. The Kappa statistic and the Kappa SD where 78.3% and 0.09 respectively. On the test dataset, the algorithm achieved an accuracy level of 96% and a kappa of 96%. The algorithm was highly effective in classifying bank performance in comparison to all algorithms. As number of banking activities increase, also implies that the data submission to the Reserve Bank continues to grow exponentially. This challenging situation in combination with advances in machine learning (ML) and artificial intelligence (AI) presents unlimited opportunities to apply neural network-based deep learning (DL) approaches to predict Zimbabwean Bank's solvency. Future work will focus on identifying more features that could possibly lead to poor bank performance and incorporate these in our models to develop a robust early warning supervisory tool based on big data analytics, machine learning and artificial intelligence.
The researcher analyses the two models that have been proposed in literature with reference to an ideal data analytics model for cybersecurity presented in Section 3.
70. Model 1: Experimental/ Prototype Model
In the first case the researcher makes reference to the model presented in [23] which although developed in the context of the public sector can be applied to the private sector organizations. The proposed model, it is to be noted was demonstrated to be effective in integrating big data analytics with cybersecurity in a cost effective way [23].
71. Model 2: Cloud computing/Outsourcing
The second model involves an organization outsourcing its data to a cloud computing service provider. Cloud computing service providers usually have advanced big data analytics models, with advanced detection and prediction algorithms and better state of the art cybersecurity technologies and better protocols because they specialize in data and networks. However, it is to be noted that cloud computing service providers are neither exempt nor immune from cyber-threats and attacks [11].
72. Application of big data analytics models in cybersecurity
There is overwhelming evidence to support this assertion with many infallible proofs that such application is not only necessary in recent times but a means to survival [11], [23]. The researcher demonstrated by identifying the characteristics of an effective data analytics model, the ideal model, that it is possible to evaluate different models. In the third hypotheses the researcher postulated that, there is an appropriate big data analytics model for cybersecurity for every institution. While the review of literature showed that institutions and countries adopt different big data analytics models for cybersecurity, the researcher also demonstrated that beside the unique requirements these models share major common characteristics for example reactors and detection algorithms are usually present in every model but differ in terms of complexity. Further, using the models presented in this Chapter it is worthy of note that many small organizations will usually adopt Model 2 whereas very large organizations and sensitive public sector organizations will adopt Model 1. This may also explain why models used may differ although the framework used in designing a data analytics model for cybersecurity in a cloud computing services provider may share similar characteristics with that developed by an institution on its own.
73. Summary of analysis
In this section the researcher presented two models for adopting data analytics models to cybersecurity. The first experimental or prototype model involves the design, and implementation of a prototype by an institution and the second model involves the use serviced provided by cloud computing companies. The researcher also demonstrated how this study addressed the hypotheses postulated. In the information era we are currently living in, voluminous varieties of high velocity data are being produced daily, and within them lay intrinsic details and patterns of hidden knowledge which should be extracted and utilized.
By applying such analytics to big data, valuable information can be extracted and exploited to enhance decision making and support informed decisions. Thus, the support of big data analytics to decision making was depicted.
V.
74. Conclusion
Machine learning algorithms as part of Artificial Intelligence can be clustered into supervised, unsupervised, semi-supervised, and reinforcement learning algorithms. The main characteristic of ML is the automatic data analysis of large data sets and production of models for the general relationships found among data.
Big data analytics is not only about the size of data but also clinches on volume, variety and velocity of data .Volume denotes big data as massive; velocity denotes the high speed of big data; variety denotes the diversity of big data; veracity denotes the degrees of trustworthiness in big data; vocabulary denotes conformity of big data to different schema, models and ontologies; and value denotes the cost and worth of big data. Big data has necessitated the development of big data mining tools and techniques widely referred to as big data analytics. Big data analytics refer to a combination of well-known tools and techniques for example machine learning, and data mining, that are capable of leveraging useful data usually hidden in big data and creating an interface in the form of linear and visual analytics.
The information that is evaluated in Big Data Analytics includes a mixer of unstructured and semi-structured data, for instance, social media content, mobile phone records, web server logs, and internet click stream data. Big data analytics makes use of analytic techniques such as data mining, machine learning, artificial learning, statistics, and natural language processing. Big Data came into existence when the traditional relational database systems were not able to handle the unstructured data generated by organization, social media, or from any other data generating source.
Passive data sources can include: Computer-based data, for example geographical IP location, computer security health certificates, keyboard typing and clickstream patterns, WAP data.Data over networks may be secured through the use of antivirus software, firewall, encryption, secure protocols, etc. However, hackers can always devise innovative ways of breaking into the network systems. An intrusion detection and prevention system is placed inside the network to detect possible network intrusions and, where possible, prevent the cyber attacks.
![Figure 2: Three levels of Machine Learning (Source: [9])](https://computerresearch.org/index.php/computer/article/download/2047/version/101423/1-Performance-of-Machine-Learning_html/26022/image-2.png)
![The NIST Cloud computing framework states that cloud computing is made up of five essential characteristics, three service models and four deployment models[28], [29], as shown on Figure4.The five (5) essential characteristics of Cloud Computing are briefly explained follows:](https://computerresearch.org/index.php/computer/article/download/2047/version/101423/1-Performance-of-Machine-Learning_html/26023/image-3.png)
![Figure 4: NIST Visual Model of Cloud Computing Definition. Source: [30]. Service delivery in Cloud computing comprises three (3) Cloud Service Models, namely Software-as-a-Service (SaaS), Platform-as-a-Service (PaaS) and Infrastructure-as-a-Service (IaaS). These three models are shown on Figure 5, are discussed below. i. Software as a service (SaaS) The provider's applications running on a cloud infrastructure provide a capability to the consumer for use. It utilizes the Internet to deliver applications to the consumers (e.g., Google Apps, Salesforce, Dropbox, Sage X3 and office 365) [31]. This is about a wide range of applications from social to enterprise applications such as email hosting, enterprise resource planning and supply chain management. The consumer only handles minimal user specific application configuration settings. SaaS provides off-the-shelf applications offered over the internet and is the most widely used service model [29]; [32]. Examples include Google Docs, Aviary, Pixlr, and the Microsoft Office Web Application.ii. Platform as a service (PaaS) PaaS provides to the consumer infrastructure for third-party applications. Just like in SaaS the consumer does not manage or control the underlying cloud infrastructure including network, servers,](https://computerresearch.org/index.php/computer/article/download/2047/version/101423/1-Performance-of-Machine-Learning_html/26024/image-4.png)

![Figure 11: Attack vectors of the attack scenarios (Source: [3])](https://computerresearch.org/index.php/computer/article/download/2047/version/101423/1-Performance-of-Machine-Learning_html/26032/image-12.png)
![Figure 12: Attack vectors robotics experimental setup (Source: [3])](https://computerresearch.org/index.php/computer/article/download/2047/version/101423/1-Performance-of-Machine-Learning_html/26033/image-13.png)
| Paradigm component | Explanation |
| Researcher uses his/her own thinking and cognition to derive | |
| Subjectivist epistemology | meaning from the research findings arrived at through interactive |
| processes with the respondents | |
| Multiple realities exist in the given setting Meaning is derived from | |
| Relativist ontology | the realities through interactions between the researcher and |
| subjects as well as among participants | |
| Researcher makes use of data collected through text messages, | |
| Naturalist methodology | interviews, conversations and reflective sessions as a participant |
| observer | |
| Balanced axiology | Research outcome will reflect the researcher's values, reporting research findings in a balanced manner |
| Classifier | Detection Accuracy (%) | Time taken to build the Model in seconds | False Alarm rate (%) | |
| Decision Trees (J48) | 81.05 | ** | ** | |
| Naive Bayes | 76.56 | ** | ** | |
| Random Forest | 80.67 | ** | ** | |
| SVM | 69.52 | ** | ** | |
| AdaBoost | 90.31 | ** | 3.38 | |
| Mutlinomal Naive Bayes + N2B | 38.89 | 0.72 | 27.8 | |
| Multinomal Naive Bayes updateable + N2B | 38.94 | 1.2 | 27.9 | |
| Discriminative Multinomal Bayes + PCA | 94.84 | 118.36 | 4.4 | |
| Discriminative Multinomal Bayes + RP | 81.47 | 2.27 | 12.85 | |
| Discriminative Multinomal Bayes + N2B | 96.5 | 1.11 | 3.0 | |
| IV. | Analysis and Research Outcomes | |||
| Complexity Parameter | Accuracy | Kappa | AccuracySD | KappaSD |
| 0.06849315 | 0.8275092 | 0.7519499 | 0.04976459 | 0.07072572 |
| 0.15753425 | 0.7783150 | 0.6683229 | 0.07720896 | 0.14039942 |
| 0.42465753 | 0.5222344 | 0.1148591 | 0.08183351 | 0.18732422 |
| sigma | c | Accuracy | Kappa | AccuracySD | KappaSD |
| 0.050398 | 0.25 | 0.783223 | 0.678536 | 0.095598 | 0.140312 |
| 0.050398 | 0.50 | 0.776007 | 0.661354 | 0.087866 | 0.132552 |
| 0.050398 | 1.00 | 0.791391 | 0.678694 | 0.080339 | 0.126466 |
| j) Linear Discriminant Algorithm |
| Accuracy | Kappa | AccuracySD | KappaSD |
| 0.8042399 | 0.7038131 | 0.1016816 | 0.159307 |
| On the training dataset, the LDA achieved an | level of 90% and a kappa of 84.64%. The algorithm only | ||
| accuracy level of 80% as in table 11. The Kappa statistic | misclassified 4 instance as moderate whose | ||
| and the Kappa SD where 70% and 0.16 respectively. On | performance is poor in comparison to the CART | ||
| the test dataset, the algorithm achieved an accuracy | algorithm. | ||
| k) K-Nearest Neighbor | |||
| K | Accuracy | Kappa | AccuracySD | KappaSD |
| 5 | 0.5988645 | 0.3698931 | 0.1280376 | 0.2158109 |
| 7 | 0.6268864 | 0.4072928 | 0.1564920 | 0.2703504 |
| 9 | 0.6621978 | 0.4715556 | 0.1747903 | 0.2881390 |
| mtry | Accuracy | Kappa | AccuracySD | KappaSD |
| 2 | 0.8272527 | 0.7421420 | 0.10396454 | 0.15420079 |
| 14 | 0.8554212 | 0.7829891 | 0.06069716 | 0.09303130 |
| 16 | 0.8482784 | 0.7718935 | 0.06455248 | 0.09881991 |
| Software and Hardware Complex (SHC): Warning-2016 | ||
| Model Attributes | Description | |
| ? | HBase, a non-relational database, facilitates analytical and predictive | |
| HBase working on HDFS (Hadoop | operations | |
| Distributed File System) | ? | Enables users to assess cyber-threats and the dependability of critical |
| infrastructure | ||
| ? | Processes large amounts of data, interacts with standard | |
| configurations servers and is implemented at C language | ||
| Analytical data processing module | ? | Special interactive tools (based on JavaScript/ CSS/ DHTML) and |
| libraries (for example jQuery) developed to work with content of the | ||
| proper provision of cybersecurity | ||
| ? | Interactive tools based on JavaScript/ CSS/ DHTML | |
| Special interactive tools and libraries | ? | Libraries for example jQuery developed to work with content for |
| ? | Designed to ensure the proper provision of cybersecurity | |
| ? | Percona Server with the ExtraDB engine | |
| Data store for example (MySQL) | ? | DB servers are integrated into a multi-master cluster using the Galera |
| Cluster. | ||
| Task queues and data caching | ? | Redis |
| Database servers balancer | ? | Haproxy |
| Web server | ? | nginx , involved PHP-FPM with APC enabled |
| HTTP requests balancer | ? | DNS (Multiple A-records) |
| Development of special client | ? | Programming languages are used: Objective C, C++, Apple iOS SDK |
| applications running Apple iOS | based on Cocoa Touch, CoreData, and UIKit. | |
| Development of applications running Android OS | ? | Google SDK |
| Software development for the web platform | ? | PHP and JavaScript. |
| Speed of the service and protection from DoS attacks | ? | CloudFare (through the use of CDN) |
| (Source: [23]) | ||