1. Introduction
he explosive growth and developments of microarray applications have enabled biologists and data mining engineers to study and observe thousands of gene expression data at the same time. Various attribute selection methodologies have been applied in the field of microarray data and in this particular case it is termed as gene selection as illustrated in [1]. Microarray data analysis has paved the way to cancer, tumor and other disease classification methods that can be used for subsequent diagnosis or prognosis. The problem of microarray data are many fold, firstly not all the data are relevant and often only a small portion of the data is related to the purpose of interest moreover noise and inconsistent data are prominent which hampers the search for the best genes for selection and classification [2]. However the major difficult aspect of microarray data is that the genes numbering in the thousands far outweighs the number of samples number in the lower hundreds if not less. This makes the task of building effective models particularly difficult and poses over fitting problems where the model does not perform well for novel patterns [3]. Thus feature selection methods being developed should be efficient in handling these issues.
Feature selection techniques can be generally divided into two broad categories depending on how the selection process interacts with classification model [4]. The first is the filter method where the importance of a feature is determined by scoring all the features based on their inherent attribute and retaining a portion of the features with higher scores while the low scoring features are removed as shown in many works including [5] and [6]. Filter methods are simple, fast and they do not require consultation with the classifier however the most obvious drawback is that it examines each feature individually and hence cannot harness the combined predictive power of features The second feature selection methodology is the wrapper model where a classification model is built by using a set of training set of features whose class labels are known and then the search for the optimal subset of features is done by repeatedly generating and evaluating possible feature using against the well known classifiers [7]. As the search for the solution is built into the classification process and as it considers the combinative predicting power of gene subsets the convergence time is higher the methods are usually complex.
Studies such as [8] and [9] have shown that the biological state of individuals is defined by their gene expression values. Therefore genes which have different expression profiles are more likely to properly identify biological states than genes having similar expression profiles. In this paper a linear regression model is proposed where one class of training dataset is considered as the base condition and generates the regression coefficients for each of the genes in the base class. Using the regression coefficients of the base condition a regression representation for the other class is generated and the difference in expression profiles between the genes of the base and non-base classes are measured. Genes with higher difference in expression profiles are given more importance and scoring of genes are generated. The base class serves as domain knowledge that is used to guide the search for discriminating genes in the dataset, [10] and [11] Year the best features. The detailed procedure of the proposed method is provided in the following section. In the simulation and result analysis section it is seen that very high classification accuracy rates are achieved using only a very small number of the genes and the proposed method generated better results compared to other filtering approaches. The proposed approach has been applied on 6 microarray datasets and their effectiveness was determined by testing them in three different types of classifiers: Support Vector Machine (SVM), Random Forest and AdaBoost.
This paper is divided into 4 sections with section 1 giving an overview of the working domain and very brief introduction to the proposed approach. Section 2 elaborates the proposed approach in detail. Section 3 covers the simulation and result analysis part of the research where the proposed method is compared with Relief F, CFS, Chi-Squared value and Gain Ratio; it is seen that the proposed approach performs better then these existing methods. Section 4 provides the conclusion and provides scope for further research or development of this research work.
2. II.
3. Proposed Approach a) Theoretical Background
Linear regression is a statistical approach that can be used for predicting and forecasting. It has been traditionally used to model relationships between a set of explanatory variables
1 2 { , ,..., } n A a a a =and the output variable b x . The idea is to derive a model using which the predictor or the output variable can be estimated using the explanatory variables [12]. In traditional feature selection applications the set of features are the input variables and the class labels are the output variables. Considering one feature a , the hypothesis function for this simple linear regression is
0 1 x b x x a = +(1)where o x and 1
x are the parameters and x b is the predictor variable. The objective is to find the values of the parameters so that it best fits the data in the training set such that the features of unknown samples can be used for classification. j x should be chosen such that ( ) x b a is as close to the training data ( , ) a b such that the following cost function is minimized
? = ? = m i i i x b a b m x x F 1 2 1 0 ) ) ( (21 ) , ((2)Here
) 1 , 0 ( x x Fis the cost function and m is the total number of samples in the training dataset. It is apparent that real world applications will require consideration of more than one feature and hence the hypothesis function will become
0 1 1 2 02 3 3 ( ) ........ x n n b a x x a x a x a x a = + + + + +(3)for convenience its assumed that 0 1 a = , therefore the feature vector A and parameter vector X becomes
0 1 3 4 . . . n a a a a A a ? ? ? ? ? ? ? ? ? ? ? ? = ? ? ? ? ? ? ? ? ? ? ? ? ? ? 0 1 3 4 . . . n x x x x X x ? ? ? ? ? ? ? ? ? ? ? ? = ? ? ? ? ? ? ? ? ? ? ? ? ? ? ( )x b a can now be written as
( ) T b a X A x = (4)T X is the transpose of parameter vector and A is the vector of explanatory variables. So the corresponding cost function ) ( X F which needs to be minimized for multiple variables, is the following:
? = ? = m i i i x n b a b m x x x x F 1 2 2 1 0 ) ) ( ( 2 1 ) ,..., , , ((5)Gradient descent is a very popular approach that has been used in many researches including linear regression. From earlier discussion it is clear that the idea is to minimize the cost function ) ( X F . Gradient descent algorithm helps find the parameter value which leads to the minimum cost. The representation of equation 5 in partial derivative term is
? = ? + = m i i j i i x j j a b a b m x x 1 ) ) ( ( 1 : ? (6)The algorithm starts with an arbitrary value j x and keeps on changing by simultaneously updating
j x for n j ,..., 2 , 1 , 0 =until convergence for each of the j x occurs.
4. b) Linear Regression on Microarray Dataset
Linear regression is a statistical approach that can be used for microarray datasets provides gene expression values for different samples. Using gene expression values to find out features and hence to classify novel samples is a common approach; however the application of linear regression to this task is a relatively fresh approach. In this proposed method the gene expression values of one class of samples of a two class microarray training dataset is used as the base class. Using this portion of dataset, a model is built which acts as the domain knowledge of the dataset.
5. Global
is calculated using all the gene data expect for its own hence
1 1 ... 2 2 1 1 0 0 ) ( ... 2 2 1 1 0 0 ) 3 ( ... 3 3 1 1 0 0 ) 2 ( ... 3 3 2 2 0 0 ) 1 ( ? ? + + + + = ? + + + + = ? + + + + = ? + + + + = ? n a n x a x a x a x n x b n a n x a x a x a x x b n a n x a x a x a x x b n a n x a x a x a x x b ? These ) (i x b?represent the statistical values of expression for each gene in the non-base subtype of the training dataset.
6. c) Proposed Algorithm
In our proposed method, basic idea of linear regression has been used. We have tried to predict a potential feature from one of the subtypes of microarray training datasets using the knowledge acquired from the other subtype of the same training dataset. At first the microarray dataset is divided into two segments test and training dataset in the similar way as most supervised learning algorithm does. One of the biggest problems of microarray data; redundancy has been handled by measuring the similarity in expression values of the genes in both types. We have eliminated those genes having similar expression values considering their ineffectiveness as important features for classification. Moreover, removing these genes gives the algorithm an efficient way of starting feature selection procedure. Training samples are then divided into two subtypes: base type and non-base type, built based on their class information. Next the parameter vector X for 1 S is generated using equation 6 and from the parameter vector X , ) (a x b? is calculated for 2 S . After the divergences and the differences are calculated, genes are sorted according to difference values in the descending order. From the sorted list of genes ) 100 ,..., 30 , 20 , 10 ( = N N highest ranked genes are chosen and their classification accuracy is evaluated using different classifiers. Section 3 shows the detailed performance evaluation of the proposed approach and its superiority compared to other existing feature selection methods.
7. III.
8. Materials and Methods
To find out how the proposed algorithm works, we have established the experiments using four different microarray datasets. We have compared our proposed feature selection algorithm with several other attribute selection procedures. Following sections describe a short description of microarray datasets and performance evaluations of the proposed method.
9. a) Datasets
The datasets are obtained from different authors. Datasets are converted into convenient way for this particular research.
The original prostate dataset was used in [13]. The dataset contains the 12,533 gene expression measurements of 102 samples. 50 of these 102 samples contain normal tissues not containing prostate tumor while 52 had prostate tumor.
Prostate cancer dataset was originally taken from dataset GSE2443 [14]. The dataset contains 12,627 gene expression values of 20 samples. Among them 10 samples contain androgen dependent tumor while other 10 contain androgen-independent tumor.
The lung cancer dataset contains two types of cancer: malignant pleural mesothelioma (MPM) and adenocarcinoma (ADCA) of lung. Among 181 tissue samples, 31 of them had MPM and 150 of them had ADCA. Each of the samples was described by 12,533 gene expression value [15].
The colon dataset was used in [16]. The dataset contains 62 samples collected from colon cancer patients. 40 tumor biopsies are from tumors and 22 normal biopsies are from healthy parts of colon of same patients. The number of genes used in this expression is around 2000.
10. b) Performance Evaluation
The implementation of the proposed algorithm of feature selection was done on MATLAB and the performance evaluation of the selection set of features for classification was performed on publicly available weka tool [16]. We have used 10 fold cross-validation for SVM classifier. The random forest procedure was run with 10 trees and AdaBoost classifier uses 10 iteration and weighted threshold of 100.
11. i. Results
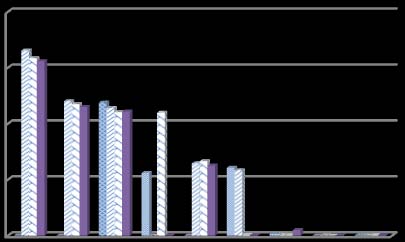
The classification accuracy of the features selected by proposed method and its comparison with Another aspect of the proposed feature selection method is; we have not used any threshold for how many features for classification will be selected. Several different subsets of features have been used for classification and thus select the best subset based on its classifying ability. Figure 1 shows the error rate in classification by the classifier with any particular feature subset. For a particular feature selection j using a particular classifier i, the average error rate is calculated With the increase of the number of features, the error rate is decreased for most all the datasets. However, for prostate cancer dataset, although the error rate increases with first few subsets of features but at the end it too shows the same characteristics as the other microarray datasets shows.
12. ii. Discussion
We have proposed a new approach of feature selection using linear regression analysis. The algorithm works twofold. At the initial stage of the algorithm, we have eliminated redundant gene by measuring the similarity in expression values. Linear regression analysis then applied on one subtype (base type) of the training dataset to build the regression model. This model then applied on the other subtype (non-base type) of the training dataset to find out the divergence of the expression values of genes in that subtype. The more deviation shown by the gene, the more important it is considered as a feature. This way set of features selected for classification of the datasets.
Our main focus in this study is to classify accurately with less number of features. Table 1-4 shows the superiority of the classification accuracy by the features selected by the proposed method for different classifiers. Although, for colon dataset, classification accuracy by the features selected by ReliefF and CFS approach shows better result than the proposed method. However the result is still comparable and the number of feature selected by the proposed method is considerably fewer than the other method of attribute selection. Also Figure 1 summarizes the effect of different feature subsets for classification.
13. IV.
14. Conclusion
Linear regression based feature selection shows promising results in classification of microarray datasets. The proposed approach might be applied on more microarray datasets and the results obtained might be used to improve some of the parameters of the proposed method. The results will also help to understand the performance of the proposed approach on a broader scale. The proposed approach can also be extended for multiclass approaches to be applied in other data mining domains. In the future Incorporation of other knowledge might help the proposed method to enhance the performance and significance of the result.

| Classifiers | ||||||
| Attribute selection method | SVM | Random Forest | AdaBoost | |||
| N | Acc (%) | N | Acc (%) | N | Acc (%) | |
| ReliefF | 100 | 80.33 | 150 | 81.97 | 100 | 88.52 |
| CFS | 17 | 67.21 | 17 | 59.02 | 17 | 67.21 |
| Chi-Squared value | 17 | 68.85 | 17 | 60.66 | 17 | 65.57 |
| GainRatio Value | 1190 | 83.61 | 1190 | 72.13 | 1190 | 85.24 |
| Proposed | 30 | 90.16 | 20 | 86.66 | 50 | 98.36 |
| Classifiers | ||||||
| Attribute selection method | SVM | Random Forest | AdaBoost | |||
| N | Acc (%) | N | Acc (%) | N | Acc (%) | |
| ReliefF | 200 | 58.33 | 150 | 66.67 | 100 | 50.00 |
| CFS | 44 | 58.33 | 44 | 25.00 | 44 | 33.33 |
| Chi-Squared value | 44 | 58.33 | 44 | 66.67 | 44 | 41.67 |
| GainRatio Value | 188 | 58.33 | 188 | 58.33 | 188 | 25.00 |
| Proposed | 20 | 91.67 | 20 | 75.00 | 10 | 83.33 |
| Classifiers | ||||||
| Attribute selection method | SVM | Random forest | AdaBoost | |||
| N | Acc (%) | N | Acc (%) | N | Acc (%) | |
| ReliefF | 100 | 93.96 | 200 | 93.96 | 100 | 97.98 |
| CFS | 37 | 89.93 | 37 | 91.27 | 37 | 93.30 |
| Chi-Squared value | 37 | 89.93 | 37 | 92.62 | 37 | 94.63 |
| GainRatio Value | 705 | 91.27 | 705 | 95.30 | 705 | 97.31 |
| Proposed | 30 | 97.98 | 40 | 97.98 | 30 | 97.98 |
| Table 4 : Colon dataset classification accuracy | ||||||
| Classifiers | ||||||
| Attribute selection method | SVM | Random forest | AdaBoost | |||
| N | Acc (%) | N | Acc (%) | N | Acc (%) | |
| ReliefF | 200 | 87.88 | 200 | 84.85 | 200 | 72.73 |
| CFS | 8 | 69.7 | 8 | 66.67 | 8 | 57.58 |
| Chi-Squared value | 8 | 81.82 | 8 | 69.70 | 8 | 63.64 |
| GainRatio Value | 62 | 81.82 | 62 | 66.67 | 62 | 69.69 |
| Proposed | 10 | 84.85 | 20 | 75.76 | 20 | 78.79 |