1. Introduction
ata mining is the process of extracting useful information from various data repositories wherein data might be present in different formats in heterogeneous environments [1] [2]. Various methods like classification, association, clustering, regression, characterization, outlier analysis can be used to mine the necessary information. In this paper we shall be focusing on classification.
Classification is the process wherein a class label is assigned to unlabeled data vectors. Clas-sification can be further categorized as supervised and unsupervised classification. In supervised classify-cation the class labels or categories into which the data sets need to be classified into is known in advance. In unsu-pervised classification the class label is not known in advance [3]. Unsupervised classification is also known as clustering. Supervised classification can be subdivided into non-parametric and parametric classification. Parametric classifier method is dependent on the pro-bability distribution of each class. Non parametric cla-ssifiers are used when the density function is not known [4].
One of the very prominent parametric supervised classification methods is support vector machines(SVM).
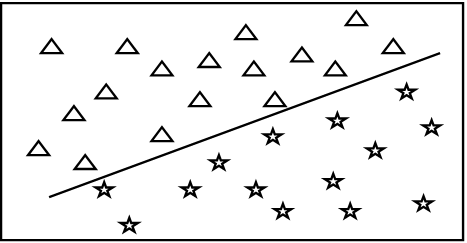
In this paper SVM are used to perform the said classification. Herein the data vectors are represented in a feature space. Later a hyperplane that geometrically resembles a slope line is constructed in the feature space which divides the space comprising of data vectors into two regions such that the data items get classified under two different class labels corresponding to the two differrent regions [5]. It helps in solving equally two class and multi class classification problem [6] [7]. The aim of the said hyper plane is to maximize its distance from the adjoining data points in the two regions. Moreover, SVM's do not have an additional overhead of feature extraction since it is part of its own architecture. Latest research has proved that SVM classifiers provide better classification results when one uses spatial data sets as compared to other classification algorithms like Bayesian method, neural networks and k-nearest neighbors classification methods [8][9].
SVM have been used to classify data in various domains like land cover classification [10], species distribution [11], medical binary classification[9], fault diag-nosis [12], character classification [5], speech recognition [13], radar signal processing [14], habitat prediction etc... In this paper SVM is used to classify remote sensed data sets. Two formats of remote sensed data viz. raster format and comma separated value(CSV) file formats have been used for performing the said classification using SVM.
Our next section describes Background Knowledge about SVM classifiers. In section 3 materials and methods viz. data acquired and the proposed methodology have been discussed. Performance analysis is discussed in Section 4. Section 5 concludes this work and later acknowledgement is given to the data source followed by references. The line mentioned herein is called a hyperplane and can be mathematically represented by equation ( 1) [21]:
2. II.
3. Background Knowledge
The data points can be represented by equation ( 2) [22]:
f(x)= sgn(mx+ b) (2)where sgn() is known as a sign function, which is mathematically represented by the following equation:
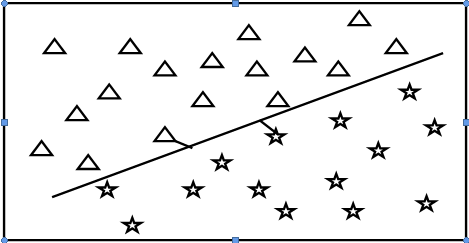
sgn(x)=? 1 if x > 0 0 if x = 0 ?1 if x < 0 (3)There can be many hyperplanes which can divide the data space into two regions but the one that increases the distance amid the bordering data points in the input data space is the result to the two class problem. The adjoining data points close to this hype-rplane are called support vectors. This concept can be illutrated geometrically as in Figure 2. This maximization problem viz. maximizing the distance between the hyperplane and the adjoining support vectors can be represented as a Quadratic Optimization Problem as in equation( 5) [22][23]:
h(m)= 1 2 m t m (5)subject to y i (mx i + b) >=1,?i The solution for this problem can be provide by a Lagrange multiplier ? i which is associated with every constraint in the main problem. The solution can be represented as: m=? ??i??i??i b=y k -m t x k for any x k such that Lagrange multiplier ? k #0 (6) The classifier can be denoted as [16]:
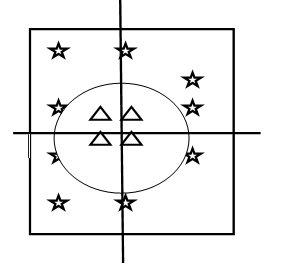
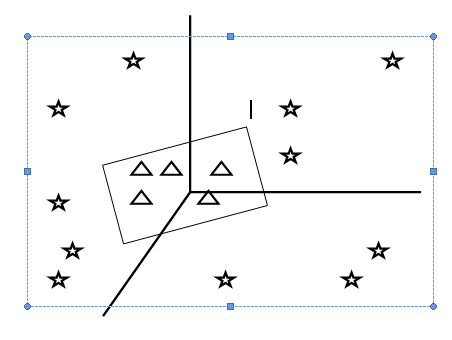
f(x)= ? ??i??i??i ?? + ??(7)In the case of non-linear SVM's the input data space can be generalized onto a higher dimensional feature space as illustrated in Fig 3. If every data point in the input data space is generalized onto a higher dimensional feature space which can be represented as [18]:
K(x i ,x j )=f(x i ) t. f(x j )(8)This is also called a kernel function. It is computed using an inner dot product in the feature space. Various kernel functions can be used to do the said mapping as mentioned in the below equations [23]: Linear Kernel function = x i t x j Polynomial kernel function = (1 + x i t x j ) p Gaussian radial based kernel function = exp(-
|???? ????? | 2 2?? 2 )Sigmoid kernel function= tanh(? 0 x i x j +? 1 ) (9)
One of the major advantages of SVM is that feature selection is automatically taken care by it and one need not separately derive features.
4. III.
5. Materials and Methods
6. a) Data Acquisition
In this paper SVM classification methodology is applied on two different data set formats. The first format of data sets used is a comma separated value(CSV) file which shall have all relevant attributes necessary for the said classification separated by comma. The data sets used in this category is taken from the birds species occurrences of North-east India [24]. The second format of data sets for classification is in raster format [25]. Raster image is a collection of pixels represented in a matrix form. Raster images can be stored in varying formats. The raster format used herein is TIFF format. A map of Andhra Pradesh state in India used.
7. b) Proposed Method
The data under consideration is first preprocessed. [26]. In the case of csv datasets comprising of information of birds of North-east India the attributes considered are id, family, genus, specific_ epit-het, latitude, longitude, ver-b-atim _scientific_ name, ve-rba-tim_ family, verbatim_ genus, verbatim_ specific_ ep-ithet and locality. A variable called churn acts as a class label which would categorize the data into two cate-goriesviz onehaving data sets of birds from Darjeeling area and the other having data sets of birds belonging to other north eastern parts in India. Before applying the clas-sification the data sets are cleaned to remove any mis-sing values. In the case of raster data set, a TIFF image is used. The image comprises of a map of Andhra Pradesh, a state in India. Initially a region of interest(ROI) is captured and later supervised SVM classification methodology is applied. Algorithm that explains implementation of SVM is given below [27]: Begin
Step 1: Loop the n data items
Step 2: Start dividing the input data set into two sets of data corresponding to two different categories
Step 3: If a data item is not assigned any of the regions mentioned then add it to set of support vectors V
Step 4: end loop
8. End
9. IV. erformance nalysis a) Environment Setting
A total of 695 data set records act as test data set and are used to authenticate the classification results obtained for CSV data sets and in the case of TIFF raster data sets one Region of interest is extracted from the given input image. The proposed method has been implemented under the environment setting as shown in Classification accuracy can be measured using parameters of a confusion or error matrix view depending on whether the event is correctly classified or no event is correctly classified as shown in Table 2[9]. And the classified results for CSV format data sets is demonstrated in Figure 4. 10), ( 11), ( 12) and ( 13 Kappa statistics=Sensitivity + Specificity -1 (13) The efficiency of the proposed SVM classifier is evaluated using the said parameters. The confusion or error matrix view for SVM classifier while classifying the CSV data sets is given in Table 3. The confusion matrix or error matrix view for SVM Classifier while classifying raster TIFF data sets is given in Table 4. Performance Measures using evaluation metrics are specified in Table 5 which are calculated using equations ( 10), ( 11), ( 12)and (13).
10. V. Conclusion
In this paper SVM classification method is used to build a classification model for two datasets. The first data set is of CSV format and the second one is a raster TIFF image. Later the classification model is validated against a test data set which is a subset of the input dataset. The performance of SVM is calculated using kappa statistics and accuracy parameters and it is established that for the given data sets SVM classifies the raster image dataset with better accuracy than the CSV dataset. The SVM classification methodology discussed herein can help in environment monitoring, land use, mineral resource identification, classification of remote sensed data into roads and land etc.. in the future.
![a) Overview of SVM Classifier Support vector machine (SVM) is a powerful tool used in solving either two class or multi class classification problem[15][16]. In a two class problem the input data has to be separated into two different categories wherein each category is assigned a unique class label[17]. A multi class classification problem can be solved by dividing it into multiple two class class-categorized into non-linear and linear SVM. Data can be represented in space as shown in Fig 1.Linear SVM can be geometrically represented by a line which divides the data space into two different regions thus resulting in classifying the said data which can be assigned two class labels corresponding to the two regions[18][19][20].](https://computerresearch.org/index.php/computer/article/download/45/version/102060/5-Supervised-Classification-of-Remote-Sensed-data_html/36602/image-2.png)

| Table1 : Environment Setting | |
| Item | Capacity |
| CPU | Intel CPU G645 @2.9 GHz processor |
| Memory 8GB RAM | |
| OS | Windows 7 64-bit |
| Tools | R, R Studio, Monteverdi tool |
| b) Result Analysis | |
| Real group | Classification result | |
| No Event | Event | |
| No Event | True Negative(TN) False Positive(FP) | |
| Event | False Negative(FN) True Positive(TP) | |
| Prediction | Reference Other parts Darjeeling | |
| Other parts 571 | 1 | |
| Darjeeling | 7 | 116 |
| Prediction | Reference Land Water | |
| Land | 78 | 0 |
| Water | 0 | 56 |
| datasets | ||
| Data set type | Accuracy | Kappa Statistics |
| CSV data sets | 98.85 | 95.97 |
| Raster TIFF data sets 100 | 100 | |