1. INTRODUCTION
ne of the most common problems that occur in the human urinary system is renal calculi, which is often called as kidney stones or urinary stones [1]. Normally, any person affected by these kidney stone diseases will suffer from considerable pain which leads to abnormal kidney function, and also the mechanism for this disease is poorly understood so far [2]. Kidney is the most salient organ in the urinary system, which not only produce urine but also helpful in purifying the blood.
The two important functions of kidney: (i) Removing harmful substances from the blood, and (ii) About ? :Assistant Professor, School of Computer Technology and Keeping the useful components in proper balance. Kidney stones appear in diverse varieties, among which the four basic types that found more often are Calcium-containing stones, Uric acid stones, Struvite or infected stones and Cystine stones [8].
Normally the kidney diseases are classified as hereditary, congenital or acquired [14]. The detection of calcifications inside the body is a large field of study including several dynamic areas of research, which is mainly useful for diagnosing the kidney stone diseases. The actual kidney stones may be rough non-spherical in shape, but the dominant effects that are used to find the fracture in actual kidney stones, are based on the reverberation time across the length of the stone [16].
Due to the presence of powerful speckle noise and attenuated artifacts in abdominal ultrasound images, the segmentation of stones from these images is very complex and challenging [12]. Hence, this task is performed by the use of much prior information such as texture, shape, spatial location of organs and so on. Several automatic and semiautomatic methods have been proposed. Even though the performance such methods are better when the contrast-to-noise ratio is high, it deteriorates quickly when the structures are inadequately defined and have low contrast like the neuroanatomic structures, such as thalamus, globus pallidus, putamen, etc. [4]. The X-ray, positron emission tomography (PET), computer tomography (CT), Ultrasound (US) and magnetic resonance imaging (MRI) are the widely available different medical imaging modalities which are broadly employed in regular clinical practice [6]. As compared to other medical imaging modalities such as computed tomography (CT) and magnetic resonance imaging (MRI), the US is particularly difficult to segment because the quality of the image is almost low than the CT and MRI [3]. Ultrasound (US) image segmentation is greatly depends on the quality of data [7]. Moreover, it is complex to extract the features that represent the kidney tissues by segmenting the kidney region [14]. Although, ultrasound imaging is widely utilized in the medical field [13] Ultrasound imaging is popular in the field of medicine not only due to its economical cost and noninvasive nature, but also it is a radiation-free imaging technique [12]. US imaging is economical and simple to use and also provides a faster and more exact procedures due to its real time capabilities. In numerous applications, an important role is played by the precise identification of organs or objects that are present in US images [3]. Resolutions required by murine imaging could be achieved in ultrasonic imaging which already has a broad variety of clinical applications for human imaging, if higher frequencies (20 -50 MHz) are used instead of the normally used frequencies (3 -15 MHz) [5]. Speckle is a multiplicative noise, which is an important performance limiting factor in visual perception of US imaging that makes the signal or lesion complicated to identify [9,10]. Numerous research papers have been presented on segmentation of renal calculi in US images by using diverse techniques. Since US kidney images are noisy and contain poor signal-to-noise ratio, an alternative effective techniques employing a-priori information may be utilized for compensating such problems [11]. The segmentation of renal calculi using renal images is a difficult task. Lots of researches have been performed for the successful segmentation of renal calculi using ultra sound images. A few recent related works in the literature are reviewed in the following section.
2. II.
3. RELATED WORK
Benoit et al. [15] have proposed a region growing algorithm for segmentation of kidney stones on ureteroscopic images. Using real video images, the ground truth has been computed and the segmentation has been compared with reference segmentation. Then for comparison with ground truth, they have calculated statistics on diverse image metrics, namely Precision, Recall, and Yasnoff Measure. Sridhar et al. [16] have constructed a framework for the identification of renal calculi. Normally, the kidney stones are formed by the abnormal collection of some specific chemicals such as oxalate, phosphate and uric acid. These stones can be found in the kidney, ureter or urinary bladder. Performance analysis has been performed to a set of five known algorithms by using the parameters namely success rate in calculi detection, border error metric and time. Then the best algorithm has been chosen from this performance analysis and the framework has been constructed by using this algorithm. Moreover, a procedure has been given to validate the detected calculi using the shadow that appear in ultrasound images. The algorithm has been tested by using the ultrasound images of 37 patients. The detected calculi based on the framework match those determined by professional clinicians in more than 95% of the cases. Sridhar et al. [17] have developed an automated system to detect the renal calculi based on its physical characteristics. Due to the anomalous collection of certain chemicals like oxalate, phosphate and uric acid, the calculi are formed in the kidney, ureter or in urinary bladder. An algorithm has been employed to identify the calculus using its shadow. The properties of calculi such as size, shape and location have also been extracted by their proposed system, which are crucial for reliable diagnosis. Their technique has been implemented in the MATLAB/IDL platform and a substantial success rate has been obtained. Tamilselvi et al. [18] have proposed an improved seeded region growing based method which performs both segmentation and classification of kidney images with stone sizes using ultrasound kidney image for the diagnosis of stone and its early identification. The images are classified as normal, stone and early stone stage by recognizing multiple classes via intensity threshold variation diagnosis on segmented region of the images. Homogeneous region are relied on the image granularity features in the enhanced semiautomatic SRG based image segmentation process, in which the pertinent structures with dimensions similar to the speckle size extracted. The shape and size of the growing regions have relied on this look up table entries. The high frequency artifacts are also being reduced by performing region merging after the region growing. By employing the intensity threshold variation acquired for the segmented parts of the image, the diagnosis process is being performed. They have compared the size of the segmented parts of the image with the standard stone sizes i.e., if the size is below 2 mm, it is considered as absence of stone, between 2-4 mm indicates early stone stage, and 5mm & above indicates presence of kidney stones.
Tamilselvi et al. [19] have suggested a segmentation method for an exact segmentation of renal calculi. Classification and segmentation are the two important steps in their proposed approach. In the preprocessing stage, the image contrast improvement is being carried out by using histogram equalization and the reference pixel are selected via GA techniques before classifying a given image either as normal or stone image. The training and the classification process of diverse US images is performed by using an ANFIS system. Moreover, the same procedure is followed for the testing process of classification approach and several US images are utilized for the analysis of the precision of preprocessing classification. Subsequently, in the calculi recognition process, ANFIS is trained by using the renal calculi images having manually segmented stone regions. Several region parameters are determined and the calculi detection training process is performed by giving the result values to the ANFIS. During the testing process, the reference and testing images are compared and morphological dilation operation is applied in the calculi regions. An accurate renal calculi region was found from the result of the testing process. The experimental results have shown that their proposed segmentation method has found the accurate renal calculi from US images. They have also analyzed the performance of the proposed method by comparing it with the existing Neural Network (NN) and SVM classifier.
The existing segmentation method has performed the calculi segmentation by region indicators and modified watershed algorithms. But in this method, the calculi detection accuracy is not satisfactory and it has produced high complexity in the calculi detection process. To avoid this drawback, we proposed a Region Indicator with Contour Segmentation (RICS) method. The outline of the paper is as follows: Section 3 briefly explains the proposed RICS segmentation process. In section 3.1, the region indictor process is explained and in section 3.2, the region parameters are computed. The contrast enhancement and most fascinated pixels by kmeans clustering are explained in section 3.3 and 3.4. In section 3.5, the Contour based regions selection process is described. The experimental result and the conclusion of this paper are given in Section 4 and 5 respectively.
4. III.
5. PROPOSED RENAL CALCULI SEGMENTATION TECHNIQUE
The proposed renal calculi segmentation method consists of five major steps namely,
} { i I B = : L i ? 1 =, is allocated. Then, each block included in B is checked to find the edge pixels present in the kidney. If any block is found to be containing edge pixels of the kidney, then the index value of the corresponding block is kept as
} { l I K = : L l ? .Q P × ; Q q P p ? ? ? ? 1 , 1 .To accomplish the region selection process, a contour extraction process is utilized.
6. The procedure for contour based region extraction Process is as follows
Step 1
Initially the contour plot of the given gray scale image t n G is extracted. The contour function is described in the following equation 6. 3.
) k , G ( G t n tc n = (6. 3) t nG is an input renal calculi gray scale image
? k is the number of evenly spaced contour levels in the plot ? In order to find the contour plot, the axis and their orientation and aspect ratio are defined.
? Where, tc n G represents the result of the extracted contours of renal calculi gray scale image
Step 2
After that, the final group values from the contour result image G tc n is selected. This group values contains some regions, then calculates the region parameters for that regions and the region parameters values are given to the ANFIS system that are referred in section 6.3.3.
Step 3
Then choose numbers of regions from the image G tc n which are greater than the threshold value 1 t and this selected region values are given to the empty mask S .
Step 4
The mask S contains s m number of regions, which is represented as
s s s m s s s M m r r r R s ? ? 1 }, , , { 2 1 = = .Next, compute the centroid values for the regions s R in the mask S , it is represented as
)} , ( ), , ( ), , ( { ) , ( 2 1 y x c y x c y x c y x C s m s s s s ? = .Step 5
There are s m number of regions in the mask S , these mask regions are not optimal to find the exact calculi from the images. So find the optimal regions among the available regions in S by exploiting Squared Euclidean Distance (SED) between the regions. Step 7
The SED difference process is described in the following equ.2&3 for both x and y coordinates values. M is generated. Over ' M and ' I an AND operation is performed followed by a morphological dilation operation and hence the resultant image U is obtained.
2 2 2 2 2 1 1 )) ( ) ( ( )) ( ) ( ( )) ( ) ( ( ) ( 2 1 x c x c x c x c x c x c x s m I n s I s I s n ? + ? + ? = ? ? (2) 2 2 2 2 2 1 1 )) ( ) ( ( )) ( ) ( ( )) ( ) ( ( ) (Multidirectional Traversal: Here we have proposed two major traversals called bottom-up traversal and top-down traversal. In each of the traversal, a left-right traversal is applied. The traversals are applied over U , which is binary. At the time of two major traversals, once the pixel with '1' is obtained, then left-right traversal is enabled so that all the regions in the same axis and the region of the first obtained pixel are removed from the mask. The survived pixel values are marked into the original test image and it is subjected to the consequent process of Thresholding.
Thresholding: Here, a chain of thresholding process is performed in the original image.
? Firstly, the pixel values that are marked by using the previous process are compared against a defined threshold value 3 By performing all the above described process in various renal calculi kidney images, the calculi region is segmented.
7. IV. RESULTS AND DISCUSSION
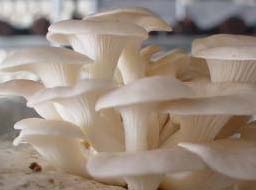
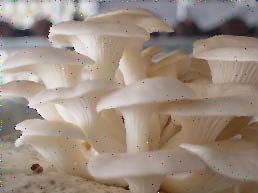
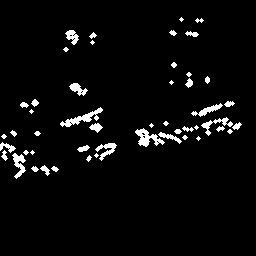
The proposed RIC segmentation technique is implemented in MATLAB platform (version 7.10) and the performance of the proposed RIC segmentation method is evaluated using 50 images. In the proposed RICS segmentation method, five major steps are performed over these training and testing renal calculi and renal ultra sound images. The sample input normal and calculi images are shown in figure 2. Finally, the selected regions from the thresholding process are given to the original image that is demonstrated in the following figure 7. In figure 7, the calculi regions are exactly marked in red color. The result image has shown that the proposed RIC segmentation method has exactly found the calculi region from the renal calculi images. The performance of proposed RIC segmentation method is analyzed with different images and it is described in the following section. The performance of the RICS segmentation method by using four testing images is given in table 1. This performance analysis exploits statistical measures [20], to compute the accuracy of calculi segmentation done by the RIC segmentation method.The performance of the RIC segmentation analysis is shown in the below Table 1.
8. ID No
9. Se
Sp Acc FPR 1, we have achieved high sensitivity, specificity and accuracy level in 1 sec computational time. The segmented stone area by RICS segmentation method is compared with previous IORM segmentation method and conventional segmentation algorithms. A relative error is calculated between the segmented stone area marked by the expert radiologist and the proposed method. The formula for the calculation of relative error is described below,


| Segmentation of Calculi from Ultrasound Kidney Images by Region Indictor with Contour Segmentation | |||||||||||||||||||||||||||
| Method | |||||||||||||||||||||||||||
| grayscale images. Histogram equalization make some | |||||||||||||||||||||||||||
| enhancements to the contrast of the given gray scale | |||||||||||||||||||||||||||
| ultra sound image. In histogram equalization all pixel | |||||||||||||||||||||||||||
| values in gray scale image are adjusted to maximum | |||||||||||||||||||||||||||
| intensity values of the image. The image that is obtained | |||||||||||||||||||||||||||
| after the histogram equalization process is denoted as | |||||||||||||||||||||||||||
| ' n t G . | |||||||||||||||||||||||||||
| e) Find Most Fascinated Pixels by K-means clustering | |||||||||||||||||||||||||||
| Mostly required pixels are computed from the t n G by utilizing the k-means clustering method. K-means clustering [22] is a method of cluster analysis image which aims on partition of observations into number of clusters in which each observation belongs to the | 2011 December | ||||||||||||||||||||||||||
| cluster with the nearest mean [21]. The steps involved in | |||||||||||||||||||||||||||
| the K-means clustering used in our method are described as following:- | 45 | ||||||||||||||||||||||||||
| (i) Partition of the gray scale data points to A arbitrary | |||||||||||||||||||||||||||
| centroids, one for each cluster. | |||||||||||||||||||||||||||
| (ii) To determine new cluster centroid by calculating the | |||||||||||||||||||||||||||
| mean values of all the cluster elements. | |||||||||||||||||||||||||||
| (iii) Determining distance between the cluster centroid | |||||||||||||||||||||||||||
| and the cluster elements and obtain new clusters. | |||||||||||||||||||||||||||
| (v) Repeat process from step (i) till a defined number of | |||||||||||||||||||||||||||
| iterations are performed. | |||||||||||||||||||||||||||
| The k-means algorithm aims at minimizing an | |||||||||||||||||||||||||||
| objective function | |||||||||||||||||||||||||||
| A H ? ? G = | d | a g C ? | a | 2 | (2) | ||||||||||||||||||||||
| a | 1 = = 1 g | ||||||||||||||||||||||||||
| In eqn (2) | a g d represents data points and a C | ||||||||||||||||||||||||||
| means center of the cluster. The resultant of the k- | |||||||||||||||||||||||||||
| means clustering process has a number of clusters, | |||||||||||||||||||||||||||
| which forms a cluster-enabled image A I . Here we can | |||||||||||||||||||||||||||
| select the cluster, with maximum white color pixel | |||||||||||||||||||||||||||
| values, and is applied to the newly created mask | ' I . | ||||||||||||||||||||||||||
| f) Contour based Region Selection Process | |||||||||||||||||||||||||||
| Region selection process performed using renal | |||||||||||||||||||||||||||
| calculi images are taken from the testing image dataset | |||||||||||||||||||||||||||
| D | t | = | { | I | t 1 | , | I | t 2 | , | ? | I | t n | }; | n | = | ? 1 | N | t | , | where | N | ||||||
| represents the total number of renal calculi images in | |||||||||||||||||||||||||||
| the dataset | t D . The dataset t D contains the images | ||||||||||||||||||||||||||
| that | are | in | the | dimension | of | d) Contrast | Enhancement | using | Histogram | ||||||||||||||||||
| Equalization | |||||||||||||||||||||||||||
| 1 | 93.33 | 99.93 | 99.92 | 0.07 |
| 2 | 89.06 | 100 | 99.98 | 0 |
| 3 | 100 | 100 | 100 | 0 |
| 4 | 100 | 100 | 100 | 0 |
| Aver | ||||
| age | 95.60 | 99.98 | 99.98 | 0.02 |
| ID | PPV | NPV | FDR | MCC |
| No | ||||
| 1 | 59.96 | 99.99 | 40.04 | 74.77 |
| 2 | 100 | 99.98 | 0 | 94.36 |
| 3 | 100 | 100 | 0 | 100 |
| 4 | 100 | 100 | 0 | 100 |
| Aver | ||||
| age | 89.99 | 99.99 | 10.01 | 92.28 |